China's domestic gas output rose faster on the year in April than in previous months, which may have limited demand for imported LNG.
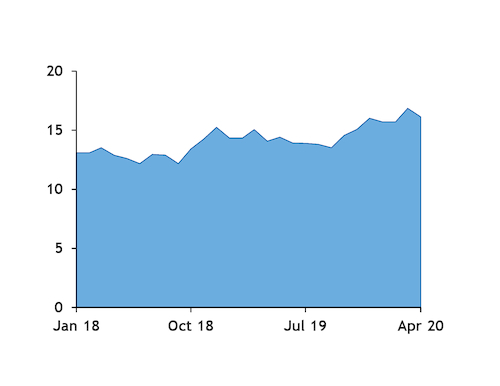
Chinese gas production rose to 16.1bn m³ in April from 14.1bn m³ a year earlier, data from the country's statistics bureau show. The production growth rate appears to have accelerated in recent months. The 14pc increase in production seen in April was again up from 12pc in March and 10pc in January-February, compared with the same period a year earlier. Chinese gas output had risen by 9.5pc in the whole of 2019 compared with the previous year.
The country's natural gas imports only inched up on the year in April, with the country's receipts of LNG and pipeline gas rising to 7.73mn t from 7.65mn t, preliminary customs data show. But Chinese LNG imports rose by around 30pc on the year in April, vessel-tracking data show, suggesting China has maintained slow pipeline imports last month.
State-owned PetroChina had already declared force majeure on some of its contracted pipeline deliveries in March as the Covid-19 outbreak weighed heavily on domestic gas demand. But the recent fall in oil prices may have provided an incentive to maintain slow pipeline deliveries and defer contractual volumes until later in the year, while boosting LNG receipts to take advantage of lower spot LNG prices as gas demand recovered. China imports piped gas from Myanmar, Turkmenistan, Kazakhstan, Uzbekistan and Russia. China's General Administration of Customs had yet to release granular gas and LNG import data.
Some Chinese buyers may have tried "to play" with force majeure to turn down purchases under long-term supply agreements and buy on the spot market instead, Total said after it disclosed it had rejected a Chinese LNG buyer's request to declare force majeure.
Chinese power demand growth rebounded in April growing by around 2pc on the year after falling in previous months (see table). Electricity demand had edged down by around 3pc on the year in March and by 7pc in January-April, as measures to control the coronavirus pandemic weighed heavily on consumption. Thermal output registered a similar increase to overall electricity demand in April.
| Chinese power generation mix | TWh | |||||
| Month | Electricity demand | Thermal | Hydro | Wind | Nuclear | Solar |
| Jan-Feb 19* | 1,098 | 843 | 48 | 135 | 57 | 15 |
| Mar-19 | 570 | 416 | 81 | 34 | 29 | 10 |
| Apr-19 | 544 | 389 | 83 | 34 | 28 | 10 |
| May-19 | 559 | 383 | 103 | 35 | 27 | 11 |
| Jun-19 | 583 | 405 | 114 | 26 | 28 | 10 |
| Jul-19 | 657 | 456 | 137 | 22 | 31 | 11 |
| Aug-19 | 668 | 473 | 129 | 22 | 33 | 11 |
| Sep-19 | 591 | 415 | 113 | 22 | 30 | 10 |
| Oct-19 | 571 | 397 | 107 | 29 | 29 | 8 |
| Nov-19 | 600 | 433 | 82 | 33 | 33 | 8 |
| Dec-19 | 654 | 508 | 69 | 36 | 33 | 9 |
| Jan-Feb 20* | 1,027 | 781 | 47 | 121 | 59 | 18 |
| Mar-20 | 552 | 389 | 31 | 76 | 43 | 13 |
| Apr-20 | 554 | 398 | 31 | 76 | 36 | 13 |
| — China statistics bureau | ||||||
| *January and February data is published as an aggregate | ||||||