Feedgas flows to US liquefaction facilities slowed further in the first half of June as export demand dropped.
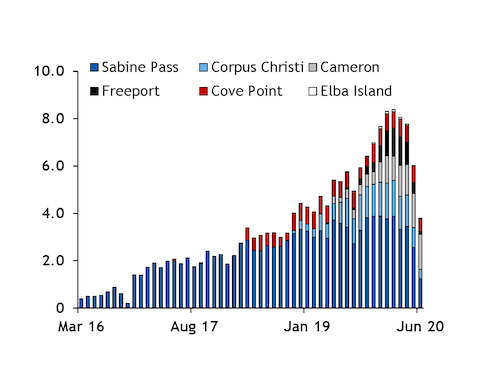
Aggregate feedgas flows to the six liquefaction facilities in the US fell to 3.8bn ft³/d (107mn m³/d) on 1-15 June from 5.35bn ft³/d a year earlier, despite additional export capacity of 29mn t/yr coming on stream over the past 12 months. Feedgas flows peaked at 8.38bn ft³/d in February, before additional capacity of about 12mn t/yr came on line. The third 5mn t/yr train at the Cameron LNG facility in Louisiana began production in May, shortly after the third 5.31mn t/yr liquefaction train at the Freeport terminal in Texas started. Four smaller liquefaction trains at the Elba Island facilities, each with a capacity of 400,000 t/yr, have also started production since February.
If maintained throughout the rest of the month and assuming 10pc of feedgas volumes are lost in the liquefaction process, this would result in aggregate exports totalling 2.26mn t in June — or about 30 cargoes, based on an average cargo size of 165,000m³. But there may be a lag of 10-15 days between the facility receiving feedgas and LNG being placed on the water because of the duration of the liquefaction process, market participants said. Feedgas flows averaged 4.78bn ft³/d on 16 May-15 June, which would be equivalent to 2.84mn t of LNG, or about 38 cargoes. This would be broadly in line with the 18 loadings seen at US facilities in the first half of this month. And loadings may pick up slightly in the second half of June, as firms with a loading slot towards the end of the month had more scope to find a profitable destination for their cargoes by taking advantage of the contango in delivered prices.
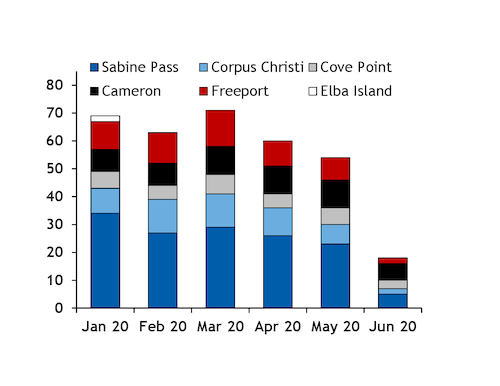
US facilities exporting approximately 38 cargoes in June would be broadly in line with the 25 June loading cargoes heard to have been cancelled by the 20 April deadline included in US LNG producer Cheniere Energy's contracts, although firms with offtake agreements from other terminals such as Cameron and Freeport can decide to cancel their cargoes at a shorter notice. Excluding the Elba Island facility, which has not exported any cargoes since January, offtake agreements at US facilities totalled around 58mn t/yr — or about 64 cargoes per month, assuming the average US cargo size. This excludes volumes contracted directly with Cheniere Energy, which typically uses excess production to meet its delivery obligations. The firm sought six cargoes for delivery to Europe through a spot tender earlier this year, suggesting it was planning to reduce its excess production and source alternative supplies on the spot market. Cheniere Energy's marketing arm expects to handle around 7.5mn t of LNG this year, and sold about 5.5mn t by November last year.
Export demand may slide further in the third quarter as lower oil-indexed prices may further squeeze margins for firms that have short positions indexed to oil to fill. Total was considering cancelling some LNG cargoes loading in the summer in order to limit losses, with low oil prices expected to have a stronger impact on its LNG business in the second half of the year, the firm said last month.
The US Energy Information Administration expects the country's LNG exports to average 3.7bn ft³/d of gas equivalent in the third quarter, equivalent to about 7.5mn t of LNG over the whole period — or just below 30 cargoes per month.