Western European power-sector gas burn inched higher on the year in July, driven by particularly strong demand from Germany, the Netherlands and Belgium.
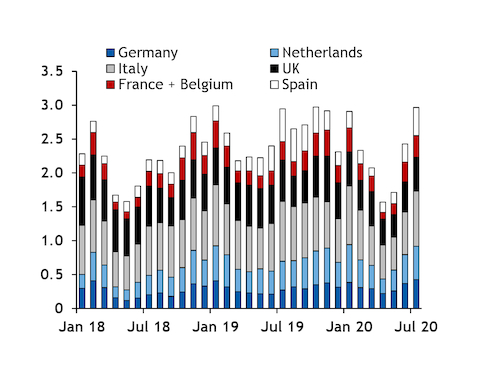
Combined power-sector gas demand in Germany, the Netherlands, Belgium, France, the UK, Italy and Spain inched up to about 2.83 TWh/d from 2.81 TWh/d a year earlier, and was sharply up from 2.29 TWh/d in June (see power sector gas burn graph). It was also well above the three-year July average, with the sector's gas use the highest for any July since at least 2011.
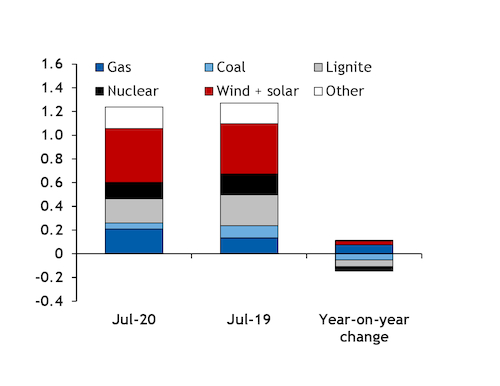
The uptick was driven by a sharp rise in output from Germany's gas-fired plants. These plants produced 209 GWh/d, well up from 134 GWh/d a year earlier, data from research institute Fraunhofer ISE show. This was the highest for any month since the 225 GWh/d in February 2012 and the strongest for any summer month since at least 2011 (see year-on-year power sector gas burn graph).
This would correspond to power-sector gas burn of about 425 GWh/d, against 272 GWh/d a year earlier, assuming a fleet efficiency of about 49pc. But with prompt gas prices in Germany's NCG and Gaspool market areas holding well below the bottom of coal-to-gas fuel-switching territory throughout the month, the efficiency of Germany's active gas-fired plants may have fallen from most recent years, lifting the sector's consumption further. Assuming an average fleet efficiency of about 45pc would lift the sector's demand to about 464 GWh/d.
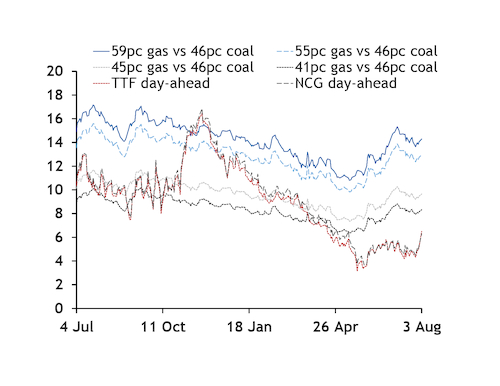
And even the country's oldest, 41pc-efficient gas-fired plants were ahead of the most modern, 46pc-efficient coal-fired units in the merit order. Prompt prices at the Dutch TTF similarly held below the country's lowest fuel-switching prices, with the Netherlands' 45pc-efficient gas-fired plants ahead of 46pc-efficient coal-fired units (see prompt vs fuel-switching gas prices graph).
German gas-fired output was up even as total power demand slipped and wind and solar output rose, pushing aggregate thermal generation lower (see German generation mix graph).
In contrast to higher gas-fired output, production from Germany's coal-fired units dropped to just 50.3 GWh/d from 103 GWh/d a year earlier. And output from lignite-fired plants slipped to 206 GWh/d from 261 GWh/d.
Dutch industrial gas demand — which includes the power sector — was the highest in July for any summer month since at least 2011. And Belgian power-sector gas demand was the highest for any summer month since at least July 2013, the latest data available.
Higher power-sector gas burn in these markets may have entirely offset a decline in non-power sector industrial demand.
Measures taken to restrain the Covid-19 outbreak and the related economic slowdown sharply cut industrial production earlier this summer. While industrial output has started to rebound as restrictions across the continent have eased, the economic recovery has been gradual. Germany's GDP fell by 10.1pc in the second quarter from January-March. And a recent uptick in Covid-19 cases in Germany and elsewhere in Europe could result in an extension or deepening of remaining restrictions, dampening demand.
Weak gas burn elsewhere offsets gains
Stronger power-sector gas burn in some markets was mostly offset by weaker gas use in the UK, Italy and Spain.
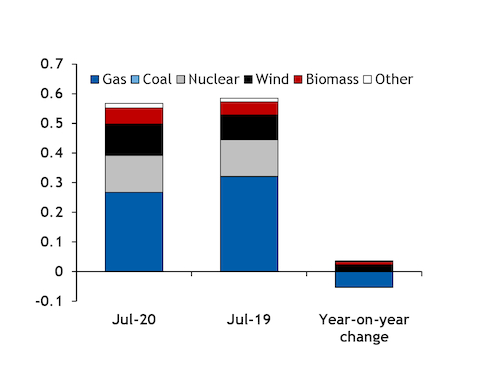
There was little scope for further coal-to-gas switching in the UK, with gas-fired plants having already almost completely displaced coal-fired units in previous years. The country's coal-fired plants did not produce any power at all in July, but output had already been minimal at 797 MWh/d a year earlier.
Wind and biomass-fired generation edged up from a year earlier, pushing some gas-fired generation out of the mix. And aggregate power demand fell, further contributing to the drop in thermal output (see UK generation mix graph).
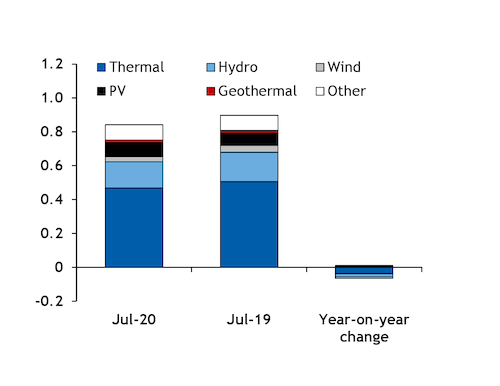
Aggregate Italian power-sector gas demand also fell, pushing some gas-fired generation out of the mix, despite PSV prompt prices holding deep in fuel-switching territory. Total Italian power generation fell on the year to 842 GWh/d from 897 GWh/d a year earlier, with the largest reduction coming from aggregate thermal output (see Italian generation mix graph).
That said, there may be scope for an increase in power-sector gas demand in these markets later in the summer.
Aggregate Italian and Spanish power demand could rise in the coming weeks on stronger cooling demand. Consistently hot weather was forecast for Rome and Madrid into mid-September. But while the weather in Rome had held in line with seasonal norms for most of July, maximum temperatures in Madrid had already been well above average leaving less scope for cooling demand to rise.