Ukraine's gas consumption increased in September from a year earlier, and was up on the year for each month in the summer despite the widespread outbreak of the Covid-19 pandemic.
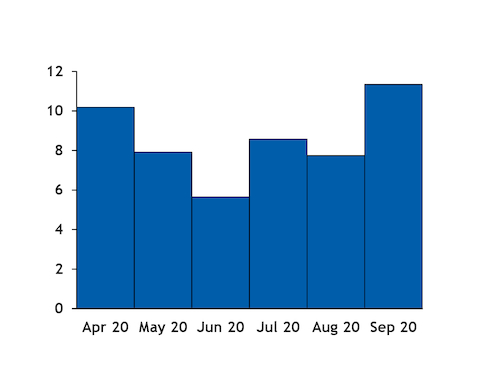
Consumption was 51.8mn m³/d last month, up from 48.9mn m³/d a year earlier and the highest for the month since 2014 (see data & download).
Strong gas use by sugar-refining plants and other factories connected with agriculture boosted demand, market participants said. The industrial sector accounted for 34-40pc of aggregate demand in recent Septembers (see table).
Warm weather may have boosted power demand for cooling purposes compared with a year earlier, with cumulative cooling degree days in Kyiv up to 205 from 96 in September 2019.
But the share of electricity produced from gas sold on a day-ahead and within-day basis at the Ukrainian exchange fell in September from July-August. Ukraine's energy ministry adopted a decree in June that directed Ukrainian energy transmission system operator Ukrenergo to prioritise coal burn for power generation until the end of October.
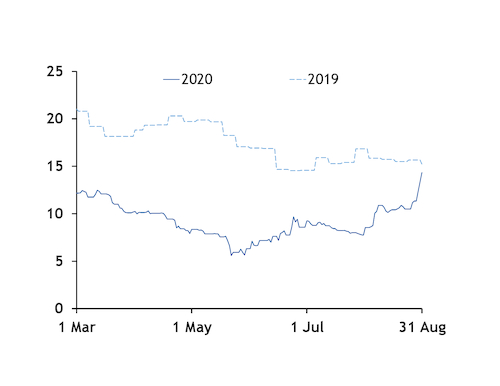
And higher prices in September — with the Ukraine VTP market following hubs further west higher — may have in any event reduced gas' competitiveness against coal for electricity generation (see summer price graph). The sharp fall in gas prices in mid-summer, before the decree to prioritise coal burn, may have bolstered gas-fired generation (see year-on-year price graph).
Household demand may have fallen on the year in September, with heating degree days in Kyiv down to 160 from 205. Gas use by distribution system operators, including for heating, made up for 31-44pc of September demand in 2016-19.
The weather was cooler than normal in the summer, with cumulative heating degree days up to 1,041 from 868. Stronger heating demand may have more than offset weaker demand from the industrial sector as lockdown measures to contain the spread of Covid-19 limited economic and industrial activity.
| Ukrainian September demand by sector | mn m³/d | |||||
| Year | Households | State-supported organisations | Power sector | Industry | DSOs | Total |
| 2016 | 9.6 | 0.1 | 3.7 | 16.2 | 29.5 | 42.8 |
| 2017 | 8.0 | 0.1 | 3.7 | 17.0 | 28.8 | 48.9 |
| 2018 | 7.0 | 0.1 | 2.5 | 15.3 | 24.8 | 44.4 |
| 2019 | 7.8 | 0.1 | 3.9 | 19.8 | 31.5 | 48.9 |
| 2020* | - | - | - | - | - | 51.8 |
| — Nerc | ||||||
| *No data by sector available | ||||||