Gas demand from households and small businesses became more responsive to the weather in the first half of November than it was in October, although it remains well below recent-year averages.
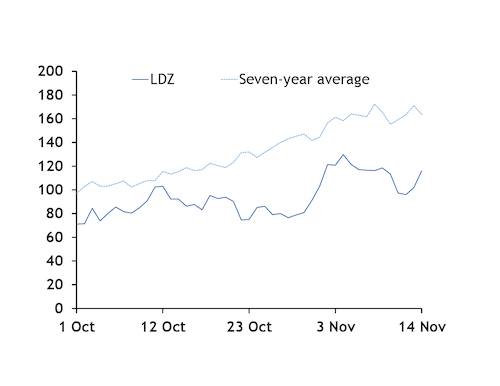
UK local distribution zone (LDZ) demand — which includes residential demand and most commercial and industrial consumption — was 113.6mn m³/d on 1-14 November, data from system operator National Grid show (see LDZ graph).
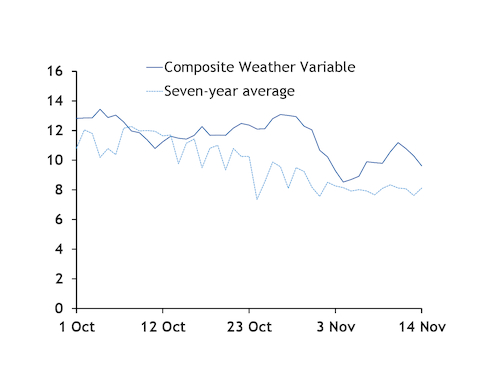
The weather has been unusually mild, pulling consumption below average. National Grid's composite weather variable (CWV), which factors in temperature and wind speeds to calculate an effective temperature, averaged 9.9°C on 1-14 November, up from 8°C over the period in 2015-21 (see CWV graph).
But had LDZ demand been as responsive to the CWV as in the previous seven years, consumption would have been expected to rise to 130mn m³/d over the period — 13pc, or 16.7mn m³/d, higher than actual demand during that time. This suggests that households and small businesses are hesitant to switch on their heating and are consuming less than in previous years relative to the weather.
That said, weather-adjusted LDZ demand has been closer to the seven-year average so far in November than in October. Actual consumption of 84.6mn m³/d in October was 21pc — or 22.6mn m³/d — below what it could have been based on the relationship between demand and the CWV in 2015-21. This suggests that as the weather turns colder, the effects of consumer behaviour changes to conserve gas in response to higher energy bills may be diminished.
Weak industrial, power sector demand
Slow demand from industry and the power sector has weighed on aggregate UK consumption so far in November.
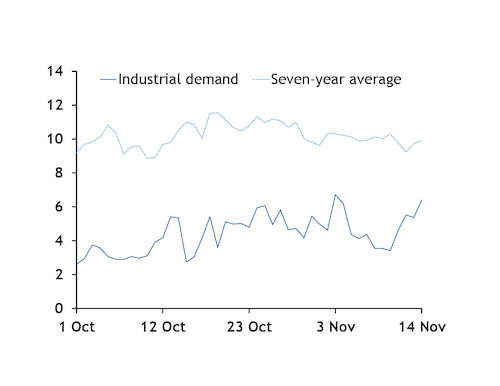
Industrial consumption of 4.8mn m³/d on 1-14 November is on track to be the lowest for any November since at least 2010. Demand from the sector has inched up from October when it fell to its lowest for any month since October 2010 (see industrial graph).
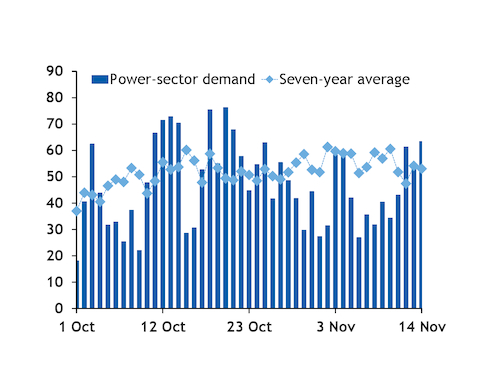
Power sector gas demand is also on course to fall to its lowest for any November since 2015 (see power sector graph). Strong wind generation has limited the call on gas-fired units, with wind output reaching an all-time daily high on 2 November.