Sales for first-quarter 2020 delivery made by Russia's state-controlled Gazprom on its online platform accounted for its largest share so far of the firm's total revenue from gas sales to Europe, excluding the Baltic states, and Turkey, based on recent corporate filings.
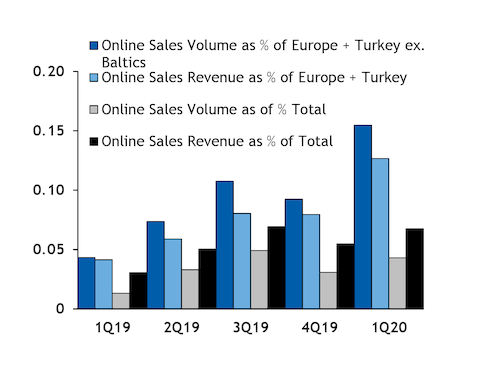
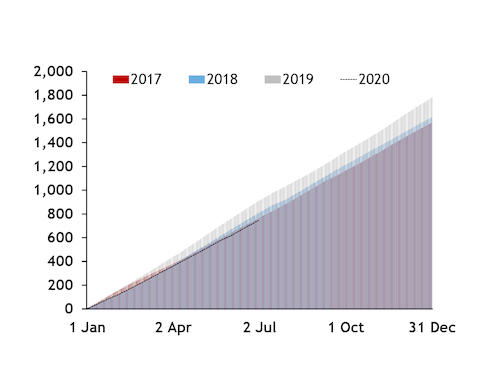
The filings and the firm's reported sales prices for monthly sales to the region suggest that online platform sales for first-quarter delivery were responsible for about 12.7pc of Gazprom's first-quarter sales revenue earned from these markets and about 6.8pc of overall first-quarter gas sales revenue. They accounted for just 4.1pc earned from these markets in January-March 2019, and 3.1pc overall, underlining the significance that quicker online sales played early this year (see online sales graph).
Online sales set a quarterly record of nearly 15.5pc of total sales by volume to the region and generated around €706.1mn or 52.7bn roubles, up from €448.6mn or Rbs33.6bn a year earlier, based on a conversion factor of 10.286 kWh/m³ used by the firm.
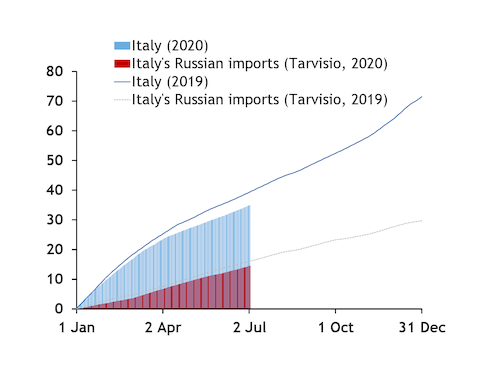
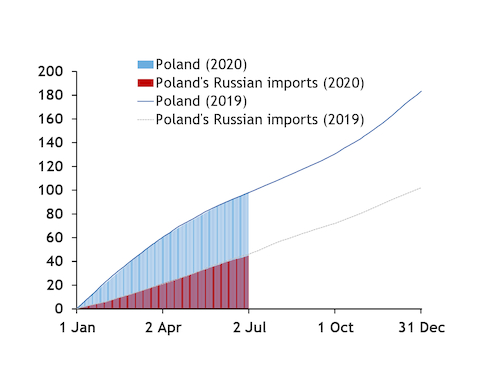
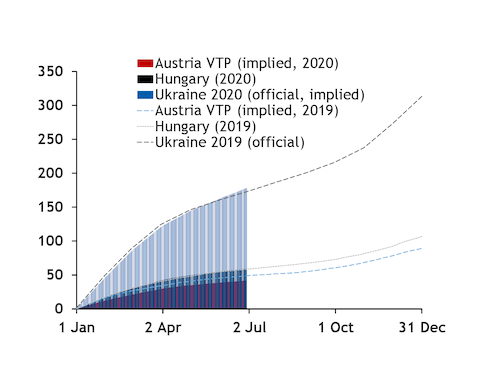
And online sales for delivery this summer have been strong so far. Gazprom had sold 9.49bn m³ as of 23 June, already higher than the 8.37bn m³ sold for all of last summer (see online sales data & download).
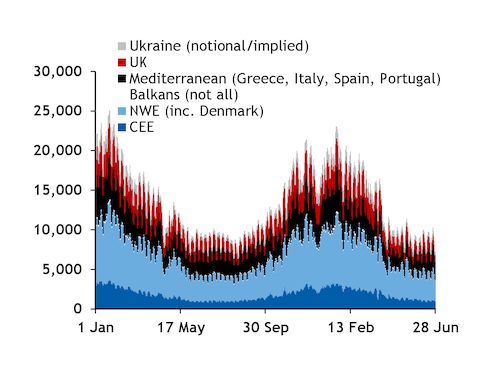
This was despite a sharp fall in aggregate Russian pipeline flows to Europe, excluding the Baltic states and Turkey. Deliveries — some of which may be for injections into Gazprom's own storage space, rather than sales — were down to 388TWh in the second quarter from 473.3TWh a year earlier (see flows graph).
But online sales' share of total revenue could fall over the rest of the year. Weak demand owing to the Covid-19 pandemic and high start-of-summer stocks have pressured European hub prices from the front of the curves, while also reducing the scope for quick sales to these markets this summer.
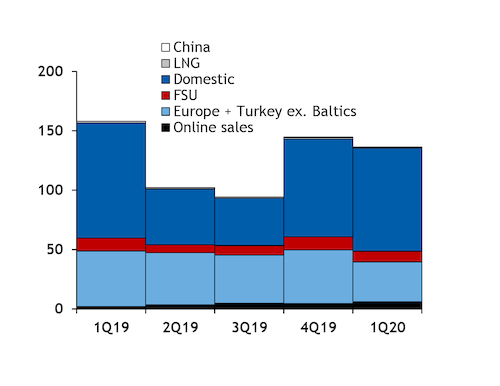
Gazprom's market share may have already deteriorated more in Europe than elsewhere in the first quarter (see sales volumes by destination graph).
The firm's sales of 39.6bn m³ of pipeline gas to Europe, excluding the Baltic states, and Turkey in January-March accounted for 29.1pc of the 136.4bn m³ of total sales, including those to China, former Soviet Union countries, domestically and as LNG. This was lower than a year earlier.
And revenue from sales to Europe, excluding the Baltic states, and Turkey accounted for around only 53.4pc of Gazprom's total gas sales revenues, down from 74.1pc a year earlier.
Gazprom's revenue was 51.5pc higher than its costs in the first quarter of 2020, down from 95.5pc a year earlier (see table). Once excluding the online sales, revenue would have exceeded costs by 44.4pc — with online sales having made a more pronounced contribution to revenue than a year earlier.
High stocks, Covid-19 crimp scope for sales
Weaker injection demand than a year earlier and low weather-adjusted consumption in Europe in the wake of the Covid-19 pandemic could make it difficult for Gazprom to maintain quick sales this summer.
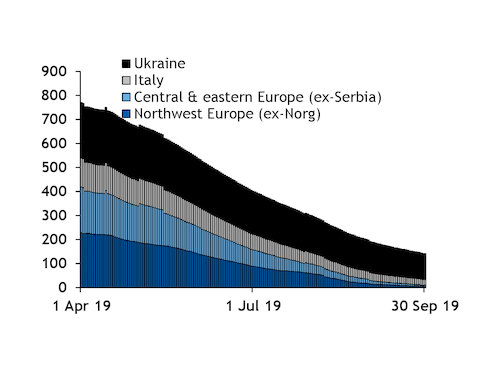
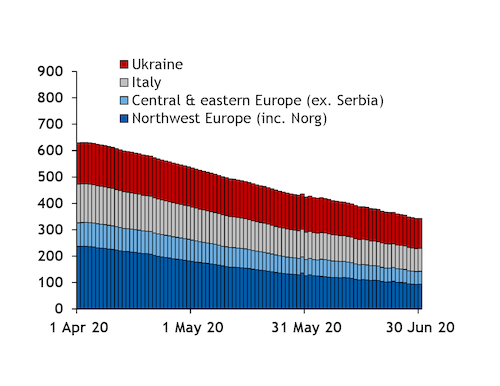
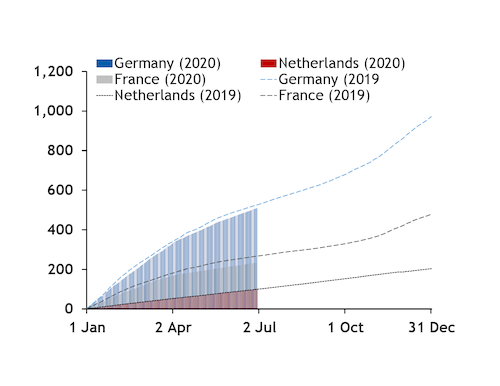
Combined storage inventories in 12 of Gazprom's 15 largest markets — based on sales last summer — of 523.1TWh on 1 April were 423.3TWh below capacity. This would limit the scope for injections — and sales by the Russian firm — compared with last summer, even assuming sites are fully replenished by the start of the winter (see space-to-fill graphs). Injections totalled 542.3TWh last summer, which was already the weakest in recent years.
And summer consumption could be muted, given Europe-wide lockdowns and slow economic recovery from Covid-19. Aggregate consumption on 1 April-28 June in these same 12 countries was 546.9TWh, down from 611.4TWh a year earlier (see demand graphs).
Gazprom registered its weakest summer sales to Europe, excluding the Baltic states, and Turkey in recent years in 2010, in the aftermath of the global financial crisis, when they were only 59.7bn m³. A repeat of that this summer would bring aggregate January-September sales to 99.3bn m³, well down from 141.6bn m³ a year earlier.
And Gazprom's annual sales to these markets have been lowest in recent years at 138.6bn m³, also in 2010.
Gazprom has said it expects to sell 166.6bn m³ of gas to Europe, excluding the Baltic states, and Turkey this year, which would leave 127bn m³ for April-December.
Low prices could limit platform sales revenue
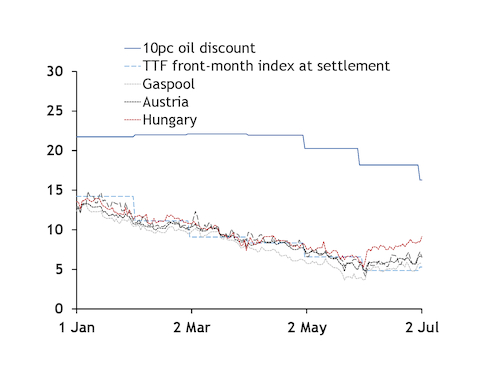
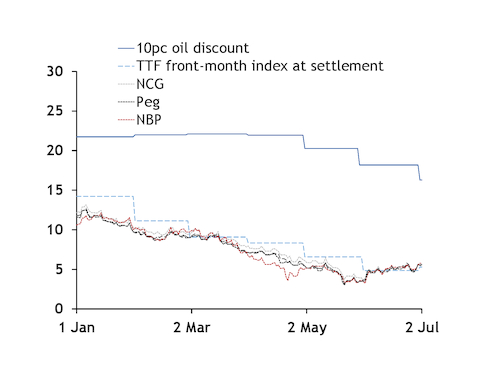
Online sales could make less of a contribution to gross revenues this summer than a year earlier, especially given the sharp fall in European prompt hub prices.
And they could make a smaller contribution relative to sales under oil-indexed contracts, given that European prompt prices have opened up a wide discount to the price of oil-linked supply assuming a 10pc discount (see price graphs).
Around 31pc of Gazprom's sales in January-September last year were made under contracts with at least some oil-indexation. Take-or-pay obligations could limit the fall in sales volumes under these contracts, although contractual clauses may allow some take to be deferred into the following years.
Gazprom's revenues may have fallen further year-on-year in the second quarter — together with its revenue-to-costs ratio — given the slide in European prompt prices. Gazprom reported a 28.8pc year-on-year fall in revenues earned from all first-quarter gas sales, and a loss, under Russian accounting standards.
| Online sales' contribution to revenue to costs ratio | % | ||
| Period | Revenue > Costs | Without online sales | Difference |
| 1Q19 | 95.2 | 90.6 | 4.52 |
| 2Q19 | 64.5 | 59.1 | 5.45 |
| 3Q19 | 40.2 | 34.0 | 6.18 |
| 4Q19 | 62.6 | 60.2 | 2.43 |
| 1Q20 | 51.5 | 44.4 | 7.09 |
| - Gazprom | |||