Aggregate Russian gas deliveries to Europe, excluding the Baltic states and Turkey, have remained much slower in May than in previous years amid muted European demand, even as they have risen slightly from April.
Combined deliveries to Europe at the Nord Stream link's German exit point in Greifswald, the Polish entry points of Kondratki and Wysokoje, all Ukrainian exit points and the Strandzha-2 point between Bulgaria and Turkey were 4.37 TWh/d on 1-17 May. This was up from 4.23 TWh/d in all of April. That said, some minor deliveries from Ukraine to Europe may have been exports from Ukraine or made under the country's short-haul programme rather than having been sent from Russia.
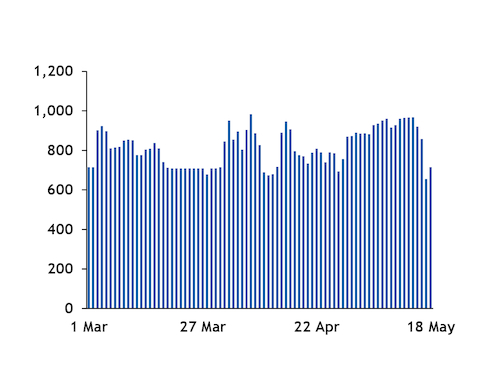
In any event, aggregate flows at these points had been further above the April average earlier this month, before deliveries along the Yamal-Europe route fell sharply on the past weekend and remained slower at the start of this week (see Kondratki graph). Deliveries to Poland along the route dropped to 685.2 GWh/d on the past two days from 924.8 GWh/d on 1-16 May, after Russian state-controlled Gazprom's long-term transit booking expired.
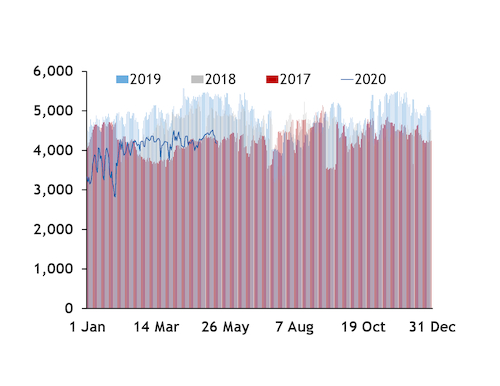
While flows so far in May were still on track to be the quickest for any month so far this year, they were still much slower than in most previous years (see total flows graph). Physical deliveries from Russia are often quicker in summer than in winter. The firm makes deliveries for injections into its own storage capacity in summer while it uses withdrawals to supplement physical flows from Russia in winter months.
High stocks, Covid-19 curb European demand
Europe's demand for Russian supply could remain much weaker than in previous summers, partly because of higher storage inventories.
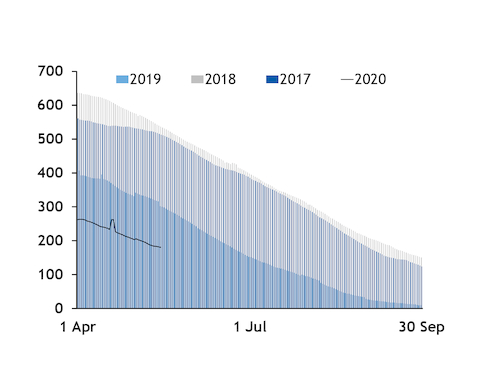
Storage space left to fill in 10 European countries that made up 70pc of Gazprom's sales to Europe, excluding the Baltic states and Turkey, last summer — France, Belgium, the Netherlands, Germany, Austria, the Czech Republic, Poland, Slovakia, Hungary and Romania — was 262.3TWh on 1 April. This was well down from 410.2TWh a year earlier, and also lower than in previous years (see space-to-fill graph). The deficit to a year earlier has since contracted but only 205.5TWh of space was left to fill on 16 May. The figures exclude the Dutch Norg site, which in previous years was filled directly from the Groningen field only, although it can take injections of supply that has been converted to low-calorie from high-calorie this summer for the first time.
Gazprom itself had higher stocks in Europe prior to the core 2019-20 heating season than in most previous years, and may have carried some of the surplus over to the summer. This could curb the firm's need to replenish its own stocks.
Lower European gas demand driven by Covid-19 restrictions and the related economic downturn may have also curbed the region's ability to take strong Russian supply.
Demand in the same 10 countries — including an estimate of apparent consumption for Austria and Slovakia based on net imports, stock movements and production — was 6.48 TWh/d on 16 March-15 May, following the imposition of strict social distancing measures across much of the region. This was down from 7.07 TWh/d a year earlier.
While weather-adjusted gas use in some markets has recently rebounded somewhat from previous weeks, economic activity could stay weak. Annualised first-quarter GDP declines were 21pc in France and 18pc in Italy — both major markets for Gazprom — the IMF said earlier this month. And these economies are likely to record even steeper second-quarter declines, it said. This could keep gas demand, particularly in the industrial sector, muted and may limit Gazprom's scope for sales.
Weaker sales expected
Gazprom recently revised down its sales forecast for this year to Europe, excluding the Baltic states, and Turkey.
The firm preliminarily forecast sales of 166.6bn m³ to these destinations. It had previously said that sales could be similar to a year earlier — when it had sold 199.3bn m³ — on a weather-adjusted basis.
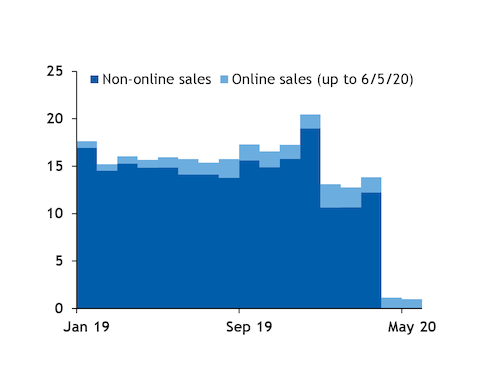
Gazprom sold 39.7bn m³ to Europe, excluding the Baltic states, and Turkey, in January-March, down from 48.9bn m³ a year earlier. Deliveries earlier in the year were lifted considerably by sales through Gazprom's online platform, which made up a higher percentage of the firm's aggregate monthly sales than during the same months last year (see Gazprom sales graph).
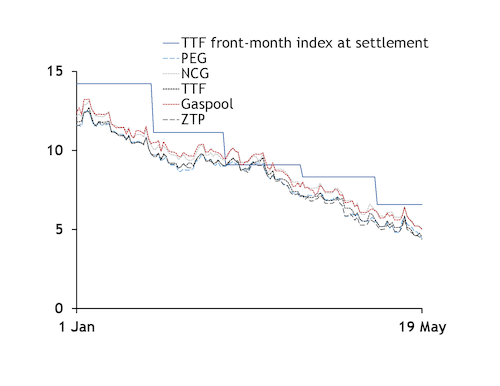
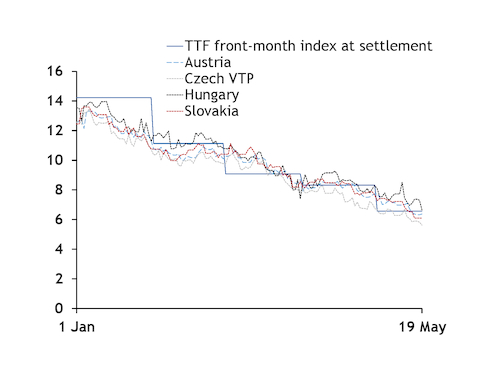
There may have regularly been little incentive for strong take under long-term contracts indexed to hub prices so far this year. Prompt prices across much of Europe have held firmly below TTF front-month index's settlements for prolonged periods in recent months (see TTF v prompt graphs).