
Argus Possibility Curves
Overview
Argus Possibility Curves deliver daily forecasts, showing the likelihood of different price outcomes for major crude grades and refined products. Each forecast presents a range of price points and the chances of each price occurring, helping you evaluate market risk with clarity.
Possibility Curves use advanced data science, machine learning and Argus' pricing data to offer a clear view of market uncertainty. This service informs decision-making in trading, hedging and risk management.
Why use Argus Possibility Curves?
Possibility Curves support the development of dynamic trading and risk tools, including scorecards which measure:
- Price volatility – identify fast-moving markets and trading opportunities
- Balance of risk – gauge upside versus downside potential to manage profit and loss impact.
- With forecasts extending up to three months ahead, you can build scorecards for crude grades, refined products, time spreads and grade spreads

Key features
Alternative physical transactions data
We couple conventional financial and macroeconomic drivers with proprietary data garnered from our role as a leading international price reporting agency.
Coverage of crude and refined products
Probabilistic forecast data for major international crude oil grades and key refined products.
Argus universe of drivers
We use more than 200 macroeconomic and financial drivers which have been specifically calibrated for the energy and commodity markets.
Machine learning
Our machine learning framework includes the use of linear and non-linear relationships, interactions between market drivers and the power to handle relatively small datasets.
Alternative physical transactions data
We are a leading price reporting agency for international energy and commodity markets, this expertise allows us to give real market context to the data.
The data and determining key drivers
Utilising proprietary deals and pricing data, augmented with fundamentals, financial and macroeconomic data.
Product specifications
Probabilistic forecasts represent the future of commodity price forecasting with their innovative approach, offering a dynamic and nuanced perspective that traditional forecasts simply can't match.
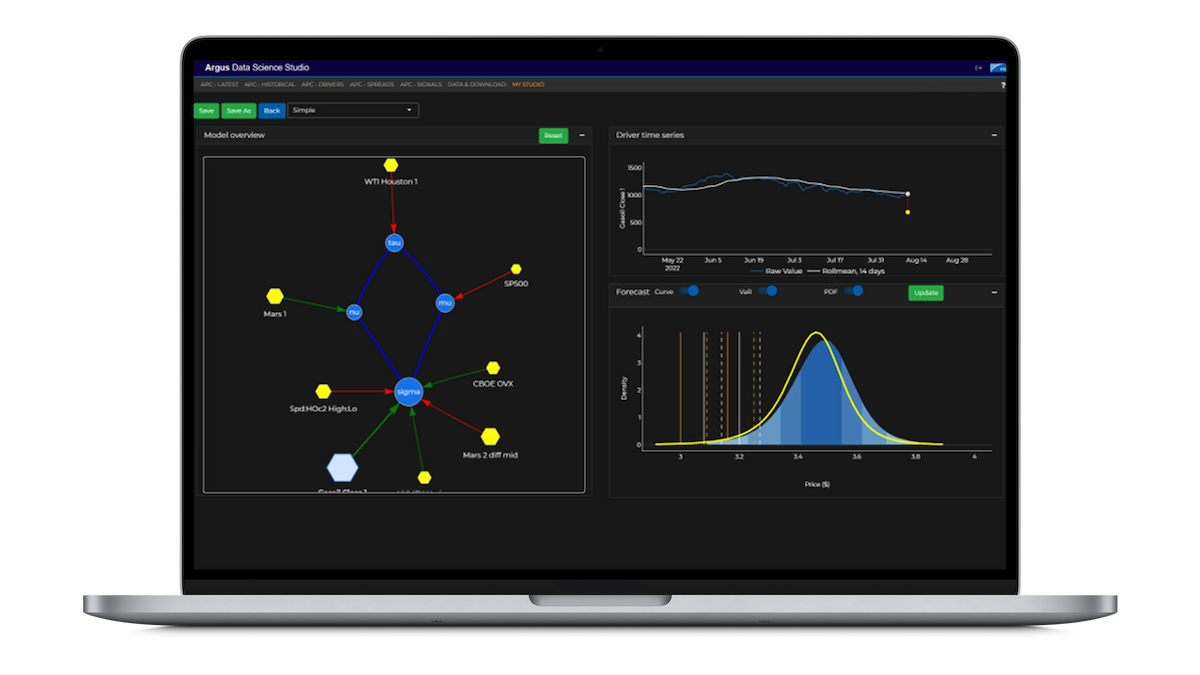
Possibility Curve via the Argus Data Science Studio
The Argus Data Science Studio is a powerful modelling tool designed to support your analytics, trading, hedging and risk management decisions. You access the Argus Possibility Curves data via the Studio, where you can visualise probabilistic forecasts and customise them by changing drivers and driver relationships to reflect your individual domain knowledge.
Learn more