
Weight of Freight: Size Matters – owners and charterers adjust to a changing tanker market
From 1967 until the oil crisis of 1973 there were orders for about 80 very large crude carriers (VLCC) and 40 ultra large crude carriers (ULCC), according to engine manufacturer Wartsila. This boom was followed by the total collapse of the newbuild market for these tankers until the middle of the 1980s. Since then, over 400 VLCC have been ordered, but it took more than 20 years before the next ULCC contract was signed.
The new TI class of ULCCs were delivered in the early 2000s, but within a decade most had been converted to floating production, storage and offloading (FPSO) vessels (FSOs) for use in the Mideast Gulf and southeast Asia. Prizing quantity over flexibility, these ships were wider than the new Panama Canal locks (begun in 2007 and completed in 2016), and could not travel through the Suez Canal unless on a ballast voyage.
Their massive capacity of more than 3mn barrels of crude oil reflected climbing global oil demand – almost double what it was in 1973 – and China’s arrival as the world's largest importer of crude oil. Some forecasters now predict oil demand will peak in 2030, reducing the need for supertankers, but other forces have seen shipowners and others return to newbuilding markets for VLCCs in recent months.
Pandemics, infrastructure projects, price wars and actual wars have moved and lengthened trade flows in the last four years, making larger vessels more attractive because of their economies of scale. These have impacted the make-up of the global tanker fleet in other ways as well, such as prompting a small recovery in interest in small Panamax tankers, which have long been sliding out of existence.
The role of vessel size in tanker freight markets is sometimes underappreciated. In the wake of the G7+ ban on imports of Russian crude and oil and products, and attacks on merchant shipping in the Red Sea and Gulf of Aden by Yemen’s Houthi militants, flows of crude oil have had to make massive diversions. Russian crude oil is flowing now to India and China rather than to Europe, while Europe’s imports of oil, diesel and jet fuel from the Mideast Gulf are taking two weeks longer, going around the Cape of Good Hope to avoid Houthi attacks. This has pushed up tonne-miles – a measure of shipping demand – to record levels. Global clean Long Range 2 (LR2) tanker tonne-miles rose to a record high in May this year, data from analytics firm Kpler show, while tonne-miles for dirty Aframax tankers rose to a record high in May last year. It has also supported freight rates.
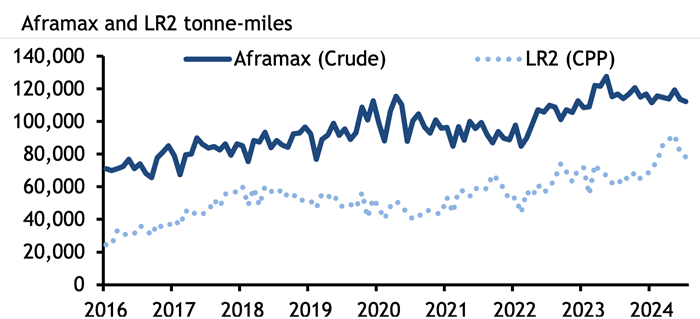
High freight rates have brought smaller vessels into competition with larger tankers, at the same time as long routes have increased the appeal of larger ships. The Atlantic basin appears to be key site for increases in production (from the US, Brazil, Guyana and even Namibia), and an eastward shift in refining capacity globally will further entrench these long routes and demand for economies of scale.
Aframax and LR2 tankers are the same sized ships carrying around 80,000-120,000t of crude oil or products. LR2 tankers have coated tanks, which allows them to carry both dirty and clean cargoes, and shipowners may switch their
LR2/Aframax vessels between the clean and dirty markets, with expensive cleaning, depending on which offers them the best returns. But an unusually high number of VLCCs – at least six – have also switched from dirty to clean recently. Shipowner Okeanis, which now has three of its VLCCs transporting clean products, said it had cleaned up another one in the third quarter.
A VLCC switching from crude to products is very rare. Switching to clean products from crude is estimated to cost around $1mn for a VLCC. It takes several days to clean the vessel's tanks, during which time the tanker is not generating revenue. But a seasonal slide in VLCC rates in the northern hemisphere this summer has made cleaning an attractive option for shipowners, while their economies of scale make the larger tankers more attractive to clean charterers as product voyages lengthen.
Argus assessed the cost of shipping a 280,000t VLCC of crude from the Mideast Gulf to northwest Europe or the Mediterranean averaged $10.52/t in June, much lower than the average cost of $67.94/t for shipping a 90,000t LR2 clean oil cargo on the same route in the same period. It is likely these vessels will stay in the products market, as cleaning a ship is a costly undertaking for a single voyage.
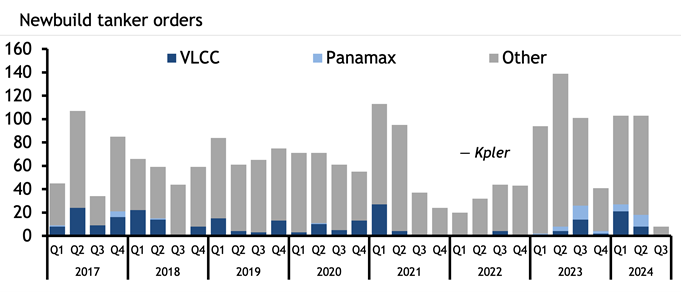
Typically, a VLCC will only carry a clean cargo when it is new and on its inaugural voyage, but just one new VLCC has joined the fleet this year, further incentivising traders to clean up vessels as demand for larger ones increases. This year has seen a jump in demand for new VLCCs, with 29 ordered so far. There were 20 ordered in 2023, just six in 2023 and 32 in the whole of 2021, Kpler data show. But the vast majority of these new VLCCs will not hit the water until 2026, 2027 or later because of a shortage of shipyard capacity.
Last year and 2024 also saw the first substantial newbuilding orders for Panamax tankers, also called LR1s, since 2017. Product tanker owner Hafnia and trader Mercuria recently partnered to launch a Panamax pool. The rationale may be that Panamax vessels can pass through the older locks at the Panama Canal, and so are not subject to the same draft restrictions imposed because of drought that has throttled transits and led to shipowners paying exorbitant auction fees to transit.
Aframaxes and MRs will remain the workhorses of crude and product tanker markets respectively, but the stretching and discombobulation of trade routes (which appear likely to stay) has already driven changes in which vessels are used and which are ordered. When these ships hit the water, they will join a tanker market very different to the one owners and charterers were operating in just four years ago.
Spotlight content


Related news
New tariffs to exclude Canadian fertilizers
New tariffs to exclude Canadian fertilizers
Houston, 22 July (Argus) — Potash and other fertilizers will be exempt from new import tariffs imposed on Canadian products this week. US president Donald Trump on 20 July signed three new orders under the Section 338 of the Tariff Act of 1930 to add a 50pc import tariff on certain Canadian goods . The new tariff will apply to a range of products, including some goods covered under the US-Mexico-Canada (USMCA) trade agreement. Fertilizer products such as potash, sulfur, and sulfuric acid were not included in the orders' list of tariffed items. The Trump administration said it seeks to revise the USMCA, which was negotiated during Trump's first term. The US Trade Representative's office on 1 July decided against renewing the deal in its current form , meaning the three countries will have to hold annual reviews and seek a consensus on a long-term extension beyond 2036. The new Section 338 tariffs will be applied beginning 19 August, 30 days after its signing. By Benedetta Tommaselli Send comments and request more information at feedback@argusmedia.com Copyright © 2026. Argus Media group . All rights reserved.
UK VAT cut widens EV charging access gap
UK VAT cut widens EV charging access gap
London, 22 July (Argus) — The UK's decision to remove value added tax (VAT) from household electricity bills could make electric vehicle (EV) home charging more affordable but widen the gap between drivers with access to home charging and those who depend on public chargers. The tax cut was announced on 21 July by Prime Minister Andy Burnham and will reduce the VAT on household electricity bills from 5pc to 0pc from 1 October. Home charging is already the cheapest way to run an EV. Charging an EV at home in the UK cost around 7p/km in May, against 26p/km using ultra-rapid public chargers, a gap that is widening (see graph) . Around 77pc of UK EV drivers have access to a home charger, while the remaining 23pc rely on public charging infrastructure, according to estimates from charging data provider Zapmap. And across the UK as a whole, 67.2pc of UK households have access to a driveway or dedicated parking space suitable for installing home charging, according to consultancy Field Dynamics. This lack of access to home charging space could limit EV uptake, regardless of policies to make home charging more affordable. The tax cut therefore favours a group that is already over-represented among EV owners. Charging operators have previously argued that policy support can disproportionately benefit motorists able to charge at home, while drivers relying on public infrastructure face higher running costs. Public charging access is still growing. The UK had more than 121,000 public chargers at the end of June 2025, according to Zapmap, with most recent additions being higher-power units. And around one-quarter of households without driveways were within a five-minute walk of a public charger in 2024, up from 12pc in 2020, according to Field Dynamics estimates. The EU is facing a similar challenge as incentives continue to support EV uptake, but increasing adoption will depend on giving drivers without private parking access to convenient and affordable charging. In the EU, attention has increasingly shifted from charger numbers to network coverage. Public charging points in the EU reached more than 1.1mn this year, up from about 199,000 in 2020, driven particularly by growth in direct-current fast-charging infrastructure (see graph) . Germany and France have the most fast chargers, while the Netherlands continues to dominate lower-power AC charging as it focuses on residential charging (see graph) . EU countries have also moved ahead of charging targets set under the EU's Alternative Fuels Infrastructure Regulation (AFIR), which links charging deployment to EV uptake and coverage along major transport corridors. The EU has exceeded AFIR fleet-based charging targets by more than 180pc on average, while 79pc of the bloc's TEN-T core network — its main motorway routes — now meet distance-based requirements, according to clean energy think-tank Transport & Environment. EV charging buildout supports incremental demand for copper, aluminium and rare earth magnets used in charging cables, power electronics and motor components. By Chris Welch UK public and home charger buildout EV public chargers by speed Running costs - ICE versus EV pence per mile Send comments and request more information at feedback@argusmedia.com Copyright © 2026. Argus Media group . All rights reserved.
South Korea’s scrap imports drop in 1H
South Korea’s scrap imports drop in 1H
Shanghai, 22 July (Argus) — South Korea's ferrous scrap imports continued to fall in the first half of the year because of lower steel output and a persistent price gap between domestic and seaborne markets. The country imported 750,000t of ferrous scrap in January-June, down by 16.5pc from a year earlier, according to Global Trade Tracker. Japan remained the top supplier, accounting for 74.5pc of South Korea's imports over the period. Japanese suppliers favoured sales to South Korea because vessel-size rules were more flexible and contracts could be settled in yen, reducing exchange-rate risk. South Korean mills have maintained long-term contracts for Japanese scrap but have not been active in the spot market for the past two years. They returned to the seaborne market in late May to secure Japanese scrap after domestic prices had risen for several months, but buying interest faded as prices began to fall in July. Imports from the US recorded the steepest decline, with mills avoiding deep-sea bulk cargoes that typically exceed 30,000t per shipment. South Korea imported more than 6mn t annually before 2020, then 4-5mn t/yr during 2020-23. Imports dropped below 2mn t in 2025 for the first time in 30 years as demand weakened further. South Korea's self-sufficiency rate for ferrous scrap is around 95pc, allowing mills to meet most of their needs domestically and buy seaborne cargoes only for prime-grade material or when overseas prices are competitive. The country's steel industry continues to face headwinds from weak construction activity and competition from cheap imported steel products. Scrap demand is likely to remain subdued while steel output stays low. South Korea exported 261,000t of scrap in the first half of the year, mainly to India, Vietnam and Bangladesh. South Korea Ferrous Scrap Imports t Country 1H 2026 % ± vs 2H 2025 % ± on year Japan 558,930 -14.5 -8.6 Thailand 42,467 -7.6 -19.8 US 21,277 -35.4 -82.0 others 127,733 -15.3 9.3 total 750,407 -15.1 -16.5 Source: Global Trade Tracker Send comments and request more information at feedback@argusmedia.com Copyright © 2026. Argus Media group . All rights reserved.
Commerce recommends keeping Moroccan phosphate duty
Commerce recommends keeping Moroccan phosphate duty
Houston, 21 July (Argus) — The US Department of Commerce today recommended keeping countervailing duties in place for Moroccan phosphate imports, despite an eight-month suspension of the measure implemented by US president Donald Trump in June. Commerce determined that the revocation of the countervailing duty order on Moroccan phosphate fertilizers would likely lead to the continuation of a countervailable subsidy, according to the preliminary results of its five-year review. Commerce said today that if the duty order were to be revoked, Moroccan producer OCP would likely receive subsidies at a level of 20.04pc from Morocco. This rate represents the original investigation rate of 19.97pc, minus a now-terminated export-tax incentive program but includes new Moroccan subsidy programs found in later administrative reviews. Late last month, Trump temporarily suspended countervailing duties on certain phosphate fertilizer imports from Morocco for eight months or until the order is terminated, citing a "supply emergency" for US farmers. There have been no confirmed sales of Moroccan phosphate to the US since Trump's suspension. With today's recommendation, it is unclear how OCP will move forward with its participation in the US fertilizer market. Commerce found that several Moroccan subsidy programs are still considered active and assumes the subsidies will continue. The 20.04pc subsidy rate reported by Commerce is not considered the new duty rate but is a recommendation for the International Trade Commission to consider. The review, which began in early March , included participation from US fertilizer producers Mosaic and Simplot, the government of Morocco and OCP. The final results of the review are expected to be published around 28 October, 240 days from the start of the review. OCP and Russian fertilizer producers have been subject to countervailing duties on phosphate exports to the US since 2021, after Mosaic filed a petition with authorities alleging the two countries' imports materially injured the US market. Commerce also recommended countervailing duties remain on Russian phosphate fertilizer imports in its five-year review's final results, saying that Russian producers would also continue to receive countervailable subsidies. Commerce's final result rates are 24.11pc for Russian producer EuroChem, 14.64pc for PhosAgro, and 16.64pc for all others, according to the ruling posted on 30 June. Commerce also noted that Russia's review process was expedited because interest from domestic parties Mosaic and Simplot was adequate, while Russia did not respond or participate in proceedings. Many fertilizer traders were not surprised by Russia's lack of participation in its sunset review, but are uncertain of how OCP will proceed after the latest ruling. By Taylor Zavala Send comments and request more information at feedback@argusmedia.com Copyright © 2026. Argus Media group . All rights reserved.