

From 1967 until the oil crisis of 1973 there were orders for about 80 very large crude carriers (VLCC) and 40 ultra large crude carriers (ULCC), according to engine manufacturer Wartsila. This boom was followed by the total collapse of the newbuild market for these tankers until the middle of the 1980s. Since then, over 400 VLCC have been ordered, but it took more than 20 years before the next ULCC contract was signed.
The new TI class of ULCCs were delivered in the early 2000s, but within a decade most had been converted to floating production, storage and offloading (FPSO) vessels (FSOs) for use in the Mideast Gulf and southeast Asia. Prizing quantity over flexibility, these ships were wider than the new Panama Canal locks (begun in 2007 and completed in 2016), and could not travel through the Suez Canal unless on a ballast voyage.
Their massive capacity of more than 3mn barrels of crude oil reflected climbing global oil demand – almost double what it was in 1973 – and China’s arrival as the world's largest importer of crude oil. Some forecasters now predict oil demand will peak in 2030, reducing the need for supertankers, but other forces have seen shipowners and others return to newbuilding markets for VLCCs in recent months.
Pandemics, infrastructure projects, price wars and actual wars have moved and lengthened trade flows in the last four years, making larger vessels more attractive because of their economies of scale. These have impacted the make-up of the global tanker fleet in other ways as well, such as prompting a small recovery in interest in small Panamax tankers, which have long been sliding out of existence.
The role of vessel size in tanker freight markets is sometimes underappreciated. In the wake of the G7+ ban on imports of Russian crude and oil and products, and attacks on merchant shipping in the Red Sea and Gulf of Aden by Yemen’s Houthi militants, flows of crude oil have had to make massive diversions. Russian crude oil is flowing now to India and China rather than to Europe, while Europe’s imports of oil, diesel and jet fuel from the Mideast Gulf are taking two weeks longer, going around the Cape of Good Hope to avoid Houthi attacks. This has pushed up tonne-miles – a measure of shipping demand – to record levels. Global clean Long Range 2 (LR2) tanker tonne-miles rose to a record high in May this year, data from analytics firm Kpler show, while tonne-miles for dirty Aframax tankers rose to a record high in May last year. It has also supported freight rates.
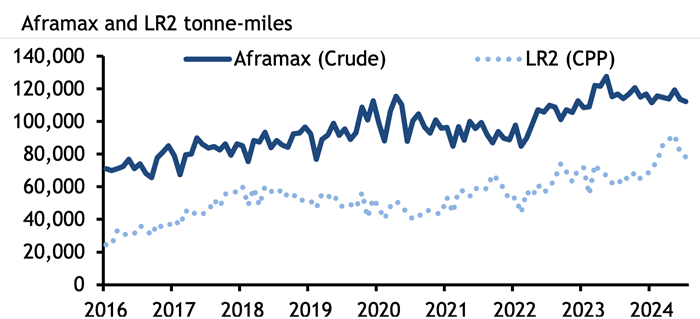
High freight rates have brought smaller vessels into competition with larger tankers, at the same time as long routes have increased the appeal of larger ships. The Atlantic basin appears to be key site for increases in production (from the US, Brazil, Guyana and even Namibia), and an eastward shift in refining capacity globally will further entrench these long routes and demand for economies of scale.
Aframax and LR2 tankers are the same sized ships carrying around 80,000-120,000t of crude oil or products. LR2 tankers have coated tanks, which allows them to carry both dirty and clean cargoes, and shipowners may switch their
LR2/Aframax vessels between the clean and dirty markets, with expensive cleaning, depending on which offers them the best returns. But an unusually high number of VLCCs – at least six – have also switched from dirty to clean recently. Shipowner Okeanis, which now has three of its VLCCs transporting clean products, said it had cleaned up another one in the third quarter.
A VLCC switching from crude to products is very rare. Switching to clean products from crude is estimated to cost around $1mn for a VLCC. It takes several days to clean the vessel's tanks, during which time the tanker is not generating revenue. But a seasonal slide in VLCC rates in the northern hemisphere this summer has made cleaning an attractive option for shipowners, while their economies of scale make the larger tankers more attractive to clean charterers as product voyages lengthen.
Argus assessed the cost of shipping a 280,000t VLCC of crude from the Mideast Gulf to northwest Europe or the Mediterranean averaged $10.52/t in June, much lower than the average cost of $67.94/t for shipping a 90,000t LR2 clean oil cargo on the same route in the same period. It is likely these vessels will stay in the products market, as cleaning a ship is a costly undertaking for a single voyage.
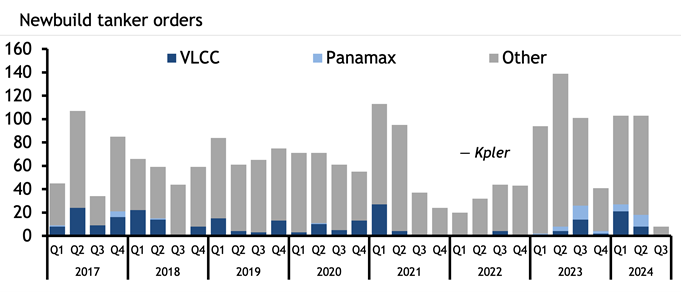
Typically, a VLCC will only carry a clean cargo when it is new and on its inaugural voyage, but just one new VLCC has joined the fleet this year, further incentivising traders to clean up vessels as demand for larger ones increases. This year has seen a jump in demand for new VLCCs, with 29 ordered so far. There were 20 ordered in 2023, just six in 2023 and 32 in the whole of 2021, Kpler data show. But the vast majority of these new VLCCs will not hit the water until 2026, 2027 or later because of a shortage of shipyard capacity.
Last year and 2024 also saw the first substantial newbuilding orders for Panamax tankers, also called LR1s, since 2017. Product tanker owner Hafnia and trader Mercuria recently partnered to launch a Panamax pool. The rationale may be that Panamax vessels can pass through the older locks at the Panama Canal, and so are not subject to the same draft restrictions imposed because of drought that has throttled transits and led to shipowners paying exorbitant auction fees to transit.
Aframaxes and MRs will remain the workhorses of crude and product tanker markets respectively, but the stretching and discombobulation of trade routes (which appear likely to stay) has already driven changes in which vessels are used and which are ordered. When these ships hit the water, they will join a tanker market very different to the one owners and charterers were operating in just four years ago.
Spotlight content
Related news
S Korea's SK On, US' Neovolta sign LFP battery deal
Singapore, 1 September (Argus) — South Korean battery maker SK On will supply US' energy storage firm Neovolta Power with 9GWh of lithium-iron-phosphate (LFP) pouch battery cells over 2027-31, conglomerate SK Innovation said on 31 August. The cell supply will come from the battery maker's facilities in US' Georgia, said SK Innovation, which owns SK On. SK On and Neovolta are planning to further partner up this year via a separate contract that involves another 9GWh of energy storage systems (ESS) battery cells from SK On, while Neovolta will provide energy storage packs in return, according to the two companies. SK earlier outlined its plans to win ESS orders amounting to 20GWh this year. Its fellow competitors such as LG Energy Solution and Samsung SDI have similarly turned to the US ESS market given an electric vehicle (EV) slowdown, repurposing their EV battery lines for ESS production. SK operates two EV battery manufacturing facilities with a current total production capacity of 22GWh in Georgia's Commerce city in the US. Its 35 GWh/yr joint EV battery cells plant with major South Korean conglomerate Hyundai Motor in Georgia started commercial production in early June. Neovolta's Pendergrass facility in Georgia has an initial battery ESS production capacity of 2 GWh/yr, with ramp up expected in July-September. The company aims to expand the site to up to 8 GWh/yr of capacity in 2028. By Joseph Ho Send comments and request more information at feedback@argusmedia.com Copyright © 2026. Argus Media group . All rights reserved.
US soybean conditions slip, corn flat
Houston, 31 August (Argus) — The national US rate of good-to-excellent soybeans fell by 2 percentage points to 58pc during the latest week, while national corn conditions were unchanged, according to US Department of Agriculture data. National soybean conditions now lag year-prior levels by 7 points and the five-year average by 1 point as of the week ended 30 August. Changes among major-growing states were mixed, with conditions in Minnesota declining by 8 points to 57pc good to excellent, but climbing by 1 to 3 points in each of North Dakota, Nebraska, Michigan, Missouri, and Indiana. The good-to-excellent rates in Iowa, Illinois, and Ohio were all flat from the week prior. Poor soybean conditions relative to the five-year average have mostly been concentrated east of the Mississippi River and in the Dakotas. Conditions in Minnesota, Iowa, Nebraska, and Missouri are all at or above the five-year average, headlined by Iowa's 77pc good-to-excellent rating, 11 points over its five-year average. Corn conditions, meanwhile, were flat at 57pc good to excellent following a 3-point decline during the week ended 23 August. As with soybeans, changes in corn conditions were mixed in major-growing states, falling by 1-3 points in Iowa, the Dakotas, Minnesota, and Wisconsin, while climbing by 2-5 points in Nebraska, Missouri, and Michigan. Illinois, Indiana, and Ohio were all unchanged week-over-week. Developmentally, the US soybean crop is 95pc setting pods and 13pc dropping leaves, 2 and 4 points over their respective five-year averages. Mature soybeans are not yet being tracked nationally, with only Arkansas, Louisiana, and Mississippi reporting so far. Corn reached 92pc dough and 62pc dented during the latest week, 3 and 6 points ahead of their five-year averages, respectively. However, the rate of mature corn has yet to accelerate ahead of the usual pace at just 13pc, down 2 points from last year and in line with the five-year average. Wheat harvests continue The US spring wheat harvest advanced by 15 points during the week ended 30 August to 77pc complete. Spring wheat harvesting is now up 5 points from year-prior levels and 9 points ahead of the five-year average. Only Montana is lagging typical levels at just 66pc complete, down 7 points from last year and 11 points from its five-year average. Minnesota is also 1 point behind 2025 but still 14 points over its five-year average. As with corn, spring wheat conditions were unchanged week-over-week at 51pc good to excellent, a 2-point gain from last year. On the winter wheat side, two more states — Idaho and Washington — finished harvesting, leaving only Montana, North Dakota, Utah, West Virginia and Wyoming incomplete. All of those states except Utah — at 41pc complete — are between 95pc and 97pc finished with their harvests. By Joseph Crosby Send comments and request more information at feedback@argusmedia.com Copyright © 2026. Argus Media group . All rights reserved.
EPA grants 18 full refinery biofuel exemptions
Houston, 31 August (Argus) — The US Environmental Protection Agency (EPA) granted exemptions from 2025 biofuel blending requirements to 18 refiners on Monday and partial exemptions to 11 others, many of which had been pending for more than a year. The agency exempted a total of 1.76bn credits by granting 18 full small refinery exemptions (SREs) and 11 partial exemptions. It denied three petitions and ruled two ineligible. In a supplemental document, the EPA said it would propose reallocating 100pc of the difference between projected and actual exempted volumes from the petitions that were fully or partially granted. Prior to deciding on the 2025 compliance year SREs, EPA estimated 990mn RINs would be exempted. SREs are a form of temporary exemption from Renewable Fuel Standard obligations for petroleum-based refineries with a nameplate capacity of 75,000 b/d or less. To receive a partial or full SRE, refiners must demonstrate that compliance would cause disproportionate economic hardship to qualify for an exemption. The EPA gave notice of the action ten days prior , when it outlined its intentions to delay the 2025 compliance deadline for RFS obligations while signaling it would first clear the backlog of unprocessed SRE petitions. In the meantime, speculation within Renewable Identification Number credit markets caused sharp swings in prices and liquidity. Concerns that total SRE volumes could reach 1.8bn credits pushed prices down to 175¢/RIN for current-year ethanol D6 credits and 188.5¢/RIN for biomass-based diesel D4 credits. RINs are credits produced and traded by refiners and importers to comply with the RFS program. Obligated parties generate credits when renewable fuels are blended into conventional transportation fuels or they can purchase credits from other RIN producers to meet their obligations. Immediately following the announcement, biofuel and agricultural industry groups voiced overall displeasure with the substantial exemptions but welcomed the EPA's intention to reallocate 100pc of the remaining volume. RIN markets moved higher sharply as well, with current year D6 credits trading at 225¢/RIN while concurrent D4 RINs last offered at 240¢/RIN. The EPA also set the date for 2025 RFS compliance at 1 October 2026, extending the deadline 30 days. By Matthew Cope US EPA 2025 Small Refiner Exemptions Refinery Location Capacity b/d 2025 SRE decision Delek Kortz Springs, Louisiana 80,000.0 Full Grant Delek Big Spring, Texas 73,000.0 Full Grant America Refining Group Bradford, Pennsylvania 11,000.0 Denial Big West Oil Salt Lake City, Utah 31,664.0 Partial Grant Calumet Great Falls, Montana 15,000.0 Full Grant Calumet Shreveport, Louisiana 57,000.0 Full Grant Chevron Salt Lake City, Utah 54,720.0 Full Grant CHS Laurel, Montana 62,500.0 Full Grant Countrymark Mount Vernon, Indiana 36,700.0 Full Grant Delek Tyler, Texas 74,000.0 Full Grant Ergon Vicksburg, Mississippi 25,000.0 Partial Grant Ergon Newell, West Virginia 22,000.0 Denial HF Sinclair Artesia, New Mexico 110,000.0 Ineligible HF Sinclair Evansville, Wyoming 31,000.0 Partial Grant HF Sinclair Sinclair, Wyoming 85,000.0 Partial Grant HF Sinclair Tulsa, Oklahoma 70,300.0 Full Grant HF Sinclair West Bountiful, Utah 41,700.0 Denial Hunt Tuscaloosa, Alabama 50,000.0 Full Grant Kern Bakersfield, California 26,000.0 Full Grant Delek El Dorado, Arkansas 83,000.0 Full Grant Marathon Mandan, North Dakota 74,000.0 Partial Grant Par Billings, Montana 61,500.0 Full Grant Phillips 66 Billings, Montana 66,000.0 Partial Grant Placid Port Allen, Louisiana 75,000.0 Partial Grant San Joaqin Bakersfield, California 15,000.0 Partial Grant Silver Eagle Evanston, Wyoming 3,000.0 Full Grant Silver Eagle West Bountiful, Utah 15,000.0 Partial Grant Cenovus Superior, Wisconsin 49,547.0 Full Grant Lazarus San Antonio, Texas 20,000.0 Full Grant Par Tacoma, Washington 40,700.0 Partial Grant United Refining Warren, Pennsylvania 67,000.0 Full Grant Vertex Saraland, Alabama 88,000.0 Ineligible CVR Wynnewood, Oklahoma 74,500.0 Full Grant HF Sinclair Sinclair, Wyoming 75,000.0 Partial Grant US Environmental Protection Agency Send comments and request more information at feedback@argusmedia.com Copyright © 2026. Argus Media group . All rights reserved.
El Nino to cut Brazil Mato Grosso 2026-27 corn crop
St Louis, 31 August (Argus) — The 2026-27 corn crop in Brazil's central-western Mato Grosso state will be smaller than the current cycle's — despite slightly more planted area — as the El Nino climate phenomenon creates great risks for yields next year. Mato Grosso's institute of agricultural economics (Imea) expect the 2026-27 second crop corn harvest to reach 53.7mn metric tonnes (t), down by 7.5pc from the 2025-26 season. The projected drop in production for next year was provided along with a 1.1pc increase to the production estimate for the current 2025-26 crop, which is now set at record 58mn t. The increase to the 2025-26 crop production estimate resulted from a 1.1pc increase to yields, which are now estimated at a record 130.11 60kg bags/hectare (ha). But the yield outlook for 2026-27 is lower. Weather conditions could limit corn productivity in the 2026-27 season. El Nino is expected to impact the development of the soybean crop this year, resulting in delays to corn planting and potentially cuts to planted area. Additionally, the increased risk of dryer weather later in the growing season creates additional risk for crop development and yields next year. As a result, Imea placed its corn yield estimate for 2026-27 at 119.64 bags/ha, an 8.1pc decrease from the current harvest. The institute expects the planted area to grow next season — up by 0.6pc to 7.48mn ha (74,800km²) — following higher domestic demand for Matto Grosso's corn. But this increased area outlook was also based on an uncertain weather outlook and could be impacted by planting delays, Imea said. Cotton The 2025-26 cotton crop's planted area estimate was reduced by less than 1pc from the previous report, but this season's production outlook was increased due to higher yields. Cotton area is now estimated at 1.37mn ha, down by only 0.07pc from Imea's August estimate. With that cut, the institute also increased this season's yield estimate by 2.6pc to 323.37 bags/ha. As of the report, Mato Grosso's cotton harvest had progressed past the halfway point, confirming the expectation of exceptional yields this year and reducing the risk that yields will be revised significantly lower, Imea said. With the revised area and yield estimates, the cotton harvest is now estimated at 6.67mn t, a 2.5pc increase from the previous estimate, but still down by 8.9pc from the previous year's harvest. Soybeans Imea maintained its 2026-27 production estimate of 48.9mn t, but weather will be a significant risk factor as planting approaches. Planting is expected to begin during September in areas with adequate soil moisture. With the risk of El Nino impacting growing conditions later this season, and adequate soil moister during planting noted as major concern for producers this season, the timing and availability of rain in the coming weeks will be critical for dictating the timing and pace of planting this season, Imea said. By Ryan Koory Send comments and request more information at feedback@argusmedia.com Copyright © 2026. Argus Media group . All rights reserved.


