

Weight of Freight: Size Matters – owners and charterers adjust to a changing tanker market
From 1967 until the oil crisis of 1973 there were orders for about 80 very large crude carriers (VLCC) and 40 ultra large crude carriers (ULCC), according to engine manufacturer Wartsila. This boom was followed by the total collapse of the newbuild market for these tankers until the middle of the 1980s. Since then, over 400 VLCC have been ordered, but it took more than 20 years before the next ULCC contract was signed.
The new TI class of ULCCs were delivered in the early 2000s, but within a decade most had been converted to floating production, storage and offloading (FPSO) vessels (FSOs) for use in the Mideast Gulf and southeast Asia. Prizing quantity over flexibility, these ships were wider than the new Panama Canal locks (begun in 2007 and completed in 2016), and could not travel through the Suez Canal unless on a ballast voyage.
Their massive capacity of more than 3mn barrels of crude oil reflected climbing global oil demand – almost double what it was in 1973 – and China’s arrival as the world's largest importer of crude oil. Some forecasters now predict oil demand will peak in 2030, reducing the need for supertankers, but other forces have seen shipowners and others return to newbuilding markets for VLCCs in recent months.
Pandemics, infrastructure projects, price wars and actual wars have moved and lengthened trade flows in the last four years, making larger vessels more attractive because of their economies of scale. These have impacted the make-up of the global tanker fleet in other ways as well, such as prompting a small recovery in interest in small Panamax tankers, which have long been sliding out of existence.
The role of vessel size in tanker freight markets is sometimes underappreciated. In the wake of the G7+ ban on imports of Russian crude and oil and products, and attacks on merchant shipping in the Red Sea and Gulf of Aden by Yemen’s Houthi militants, flows of crude oil have had to make massive diversions. Russian crude oil is flowing now to India and China rather than to Europe, while Europe’s imports of oil, diesel and jet fuel from the Mideast Gulf are taking two weeks longer, going around the Cape of Good Hope to avoid Houthi attacks. This has pushed up tonne-miles – a measure of shipping demand – to record levels. Global clean Long Range 2 (LR2) tanker tonne-miles rose to a record high in May this year, data from analytics firm Kpler show, while tonne-miles for dirty Aframax tankers rose to a record high in May last year. It has also supported freight rates.
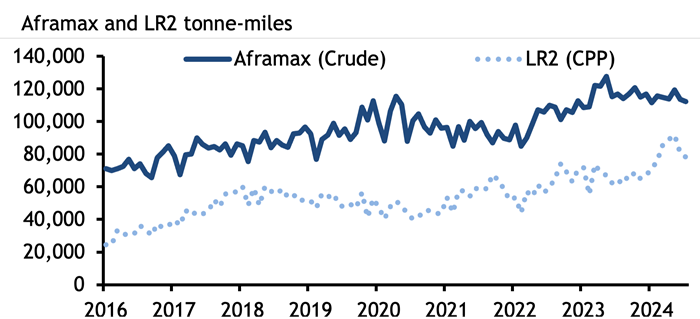
High freight rates have brought smaller vessels into competition with larger tankers, at the same time as long routes have increased the appeal of larger ships. The Atlantic basin appears to be key site for increases in production (from the US, Brazil, Guyana and even Namibia), and an eastward shift in refining capacity globally will further entrench these long routes and demand for economies of scale.
Aframax and LR2 tankers are the same sized ships carrying around 80,000-120,000t of crude oil or products. LR2 tankers have coated tanks, which allows them to carry both dirty and clean cargoes, and shipowners may switch their
LR2/Aframax vessels between the clean and dirty markets, with expensive cleaning, depending on which offers them the best returns. But an unusually high number of VLCCs – at least six – have also switched from dirty to clean recently. Shipowner Okeanis, which now has three of its VLCCs transporting clean products, said it had cleaned up another one in the third quarter.
A VLCC switching from crude to products is very rare. Switching to clean products from crude is estimated to cost around $1mn for a VLCC. It takes several days to clean the vessel's tanks, during which time the tanker is not generating revenue. But a seasonal slide in VLCC rates in the northern hemisphere this summer has made cleaning an attractive option for shipowners, while their economies of scale make the larger tankers more attractive to clean charterers as product voyages lengthen.
Argus assessed the cost of shipping a 280,000t VLCC of crude from the Mideast Gulf to northwest Europe or the Mediterranean averaged $10.52/t in June, much lower than the average cost of $67.94/t for shipping a 90,000t LR2 clean oil cargo on the same route in the same period. It is likely these vessels will stay in the products market, as cleaning a ship is a costly undertaking for a single voyage.
Typically, a VLCC will only carry a clean cargo when it is new and on its inaugural voyage, but just one new VLCC has joined the fleet this year, further incentivising traders to clean up vessels as demand for larger ones increases. This year has seen a jump in demand for new VLCCs, with 29 ordered so far. There were 20 ordered in 2023, just six in 2023 and 32 in the whole of 2021, Kpler data show. But the vast majority of these new VLCCs will not hit the water until 2026, 2027 or later because of a shortage of shipyard capacity.
Last year and 2024 also saw the first substantial newbuilding orders for Panamax tankers, also called LR1s, since 2017. Product tanker owner Hafnia and trader Mercuria recently partnered to launch a Panamax pool. The rationale may be that Panamax vessels can pass through the older locks at the Panama Canal, and so are not subject to the same draft restrictions imposed because of drought that has throttled transits and led to shipowners paying exorbitant auction fees to transit.

Aframaxes and MRs will remain the workhorses of crude and product tanker markets respectively, but the stretching and discombobulation of trade routes (which appear likely to stay) has already driven changes in which vessels are used and which are ordered. When these ships hit the water, they will join a tanker market very different to the one owners and charterers were operating in just four years ago.


Spotlight content


Related news
Increase in Iran ship attacks follows rise in targets
Increase in Iran ship attacks follows rise in targets
New York, 8 October (Argus) — Iran's recent increase in vessel attacks in the strait of Hormuz is likely the result of an increase in the number of targets in the region, but it is unclear whether this resurgence of attacks will hamper rising oil flows through the strait. Iran has increased the pace of its attacks against commercial shipping in the last week, with increasingly deadly results. Two attacks occurred around the strait of Hormuz on Wednesday, including the first attack inside the Mideast Gulf in a month, which resulted in multiple casualties . The number of casualties in the incident has not yet been confirmed. "Iran has seemingly more targets to shoot at now, which could mean that the same probability of impact is resulting in higher raw numbers of successful attacks," Joshua Tallis, research program director at the Center for Naval Analyses, told Argus . It is difficult to assess if Iran has improved its ability to target ships without the coastal radar capabilities the US claims it destroyed as part of its increased strikes in July, Tallis said. But it is reasonable to assume the country has adapted. "Higher traffic creates more opportunities for exposure, while shuttle operations send the same ships repeatedly through the risk area," Claire Jungman, director of maritime risk and intelligence at vessel tracking firm Vortexa, told Argus . Through 24 September, Vortexa identified 148 tankers involved in shuttle operations, with 85 tankers active during September, up from 11 in April, with 42 of those tankers completing four or more runs through the strait of Hormuz. "That repeat participation is important: this has become a regular operating model for a core group of ships," Jungman said. It is unclear if the recent increase in attacks against tankers will stymie the recovery of crude exports that are making their way — albeit very expensively and inefficiently — through the strait of Hormuz. "It's still a bit too early to say whether the most recent salvos would have an impact, but in the past we've seen attacks did not deter the main actors in the shuttle trade," Tomer Raanan, senior maritime intelligence analyst at Lloyds List Intelligence told Argus . By Charlotte Bawol Send comments and request more information at feedback@argusmedia.com Copyright © 2026. Argus Media group . All rights reserved.
Houthis renew threats against Saudi oil facilities
Houthis renew threats against Saudi oil facilities
Dubai, 8 October (Argus) — Yemen's Houthis renewed threats against Saudi oil facilities, airports and aviation on 8 October as fighting escalates between the group and forces aligned with Yemen's Saudi-backed internationally recognised government. "The armed forces warn all employees, experts and engineers working at all Saudi oil facilities not to be present in locations that represent targets for our forces so as not to endanger their lives," Houthi military spokesman Yahya Saree said. Saree said the warning covered facilities that had not previously been attacked, as well as those already targeted by the group. The Houthis have repeatedly targeted Saudi energy infrastructure in recent weeks. They most recently claimed attacks on state-controlled Saudi Aramco facilities in Riyadh and Khurais on 4 October, after reporting a separate strike on an Aramco site in Riyadh a day earlier. The group said the attacks caused fires. Two sources separately confirmed an incident at the 126,000 b/d Riyadh refinery on 3 October, with one saying a storage tank was hit. There was no independent confirmation of the subsequent attacks. The group has also previously targeted the 400,000 b/d Jizan refinery on Saudi Arabia's Red Sea coast and facilities further north in Yanbu. Saree also renewed an earlier threat against Saudi civilian airports and aircraft using the country's airspace. Several Saudi airports have come under Houthi missile and drone attack in recent weeks. Saudi aviation regulator GACA said late on 7 October that attacks on Riyadh's King Khalid International airport and Abha International airport this week had killed three people and injured 36. The Houthis claimed another missile attack on King Khalid airport early on 8 October, which they said "struck its target with precision and caused a disruption of airport operations". Navigation service Flightradar24 listed 322 flights scheduled to arrive at or depart King Khalid International airport as cancelled and 185 as delayed as of 17:00 local time today. By Nader Itayim Send comments and request more information at feedback@argusmedia.com Copyright © 2026. Argus Media group . All rights reserved.
India readies for global carbon trading ahead of Corsia
India readies for global carbon trading ahead of Corsia
Mumbai, 8 October (Argus) — India is preparing to launch compliance trading under its Carbon Credit Trading Scheme (CCTS) and access international carbon markets before the mandatory phase of the International Civil Aviation Organisation's (Icao) Carbon Offsetting and Reduction Scheme for International Aviation (Corsia) begins in 2027. The move could bolster the domestic carbon market and investment in emissions-cutting projects. The CCTS compliance market represents the future of carbon trading in India, SAF Association (Safa) Secretary General Rohit Kumar said at the India SAF Conclave and Awards in New Delhi on 28 September. CCTS carbon prices could reach $10/t of CO2 equivalent (CO2e), offering investors better returns than voluntary markets, where prices are uncapped. The CCTS is India's compliance carbon market, requiring obligated entities in emissions-intensive sectors to meet government-set greenhouse gas intensity targets. Firms that outperform their targets earn carbon credit certificates (CCCs), while those that fall short must acquire certificates to meet compliance obligations. Trading of CCCs is overseen by the Central Electricity Regulatory Commission through approved exchanges. India is expected to participate in Corsia's mandatory second phase from 2027. Under the scheme, airlines can reduce their compliance obligations by using eligible sustainable aviation fuel (SAF) or through Corsia Eligible Emissions Units (CEEUs), which are generated through international green projects, to compensate for the additional carbon emissions. India's proposed 1pc SAF blend in jet fuel alone may not meet future Corsia compliance requirements, industry participants said. CCCs generated under the CCTS could potentially contribute to international aviation compliance only if the underlying credit programme and units satisfy Icao eligibility requirements and receive host-country authorisation. This would require host-country approval, including Letter of Authorisation (LoA) by the government for units to be traded and utilized internationally. The global SAF market could reach $1 trillion by 2050, Kumar said, underscoring the role of carbon markets in attracting investment in high-quality green projects. "As the relevant frameworks develop, Corsia can become an important channel for accelerating India's climate transition and strengthening its participation in international carbon markets," Kumar told Argus separately. Carbon security The government should issue LoAs for projects already aligned with Corsia; otherwise, buyers may have to source credits from international markets, industry participants said. Major economies often buy credits from least developed countries (LDCs), where forestry and agriculture offer largely untapped carbon potential and domestic compliance obligations are limited or absent. European airlines participating in Corsia typically source credits from Icao-approved international carbon crediting programmes. Platforms such as the International Air Transport Association (Iata) Aviation Carbon Exchange (ACE) provide access to crediting programmes including Verra, Gold Standard, American Carbon Registry (ACR) and the Climate Action Reserve (CAR) registry. These programmes issue carbon credits that airlines can buy and retire to comply with Corsia requirements. India does not want to rely on overseas carbon credits. In 2025, it established the National Designated Authority for Implementation of Article 6 of the Paris Agreement (NDAIAPA) to assess, approve and authorise carbon-credit projects aligned with India's Nationally Determined Contributions (NDCs) and international mitigation schemes such as Corsia. But the framework and its implementation remain unclear. Regulatory hurdles India's carbon market can expand internationally if project developers, crediting programmes, investors, airlines and overseas buyers operate under a predictable framework, Safa's Kumar said. The framework should define host-country approval and LoA requirements; eligibility of activities and credits under Article 6.2; authorisation for other international mitigation purposes, including Corsia; first transfers and corresponding adjustments; registry and serial-number tracking; treatment of authorised and non-authorised credits; reporting in India's Biennial Transparency Report; and safeguards against double counting, claiming and use. "India's key advantage is the scale of its mitigation opportunity. Its large energy-intensive industrial base offers substantial potential for energy efficiency, process optimisation, fuel switching, renewable-energy integration and deployment of low-carbon technologies," Kumar added. Under Article 6 of the UN Paris Agreement, a carbon credit cannot count towards both a country's NDC and an international aviation obligation such as Corsia. India therefore needs clear rules to prevent double counting. The government is developing a framework to meet Corsia requirements, support domestic climate goals and build a strong carbon asset base for global markets. By Nikhil Sharma Send comments and request more information at feedback@argusmedia.com Copyright © 2026. Argus Media group . All rights reserved.
South Korea unveils $747bn energy transition plan
South Korea unveils $747bn energy transition plan
Singapore, 8 October (Argus) — South Korea's government on 7 October unveiled the Korea Green Transformation (K-GX) strategy, a 1 quadrillion South Korean won ($747bn) plan for 2026-35 aimed at advancing the country's energy transition and decarbonisation goals. Under the K-GX strategy, South Korea aims to decarbonise five greenhouse gas emitting sectors — steel, petrochemicals, oil refining, cement and semiconductors — develop more renewable energy, and increase electrification in the transport sector. South Korea aims to mass produce hydrogen-reduced steel, and targets the pilot operation of a 300,000t hydrogen-based steelmaking facility by 2030. In the petrochemical sector, the government aims to develop the technology for electric naphtha cracking, as well as increase the use of low-carbon fuels and feedstocks. The country aims to achieve 100GW of renewable energy by 2030 and will identify locations for solar and wind power projects, as well as lower the unit cost of renewable energy generation. It also aims to upgrade power transmission networks and distribution infrastructure. South Korea aims to raise the proportion of electric or hydrogen-powered vehicles sold to over 70pc by 2035. It aims to do this by establishing a subsidy system for sustainable fuels, and promote adoption by revising electric vehicle subsidies to account for local renewable energy production. The country also plans to conduct extensive electrification of public transport such as railways and buses. The financing package consists of 200 trillion won in fiscal funds, and over 790 trillion won in climate finance. The country aims to expand its climate response fund to achieve this, and the institutional frameworks and detailed plans for government bonds will be established by the first half of 2027. The 790 trillion won will mainly be allocated to local governments and small and medium-sized enterprises. The government will implement tax incentives and regulatory improvements, it said. It will also boost tax support by introducing domestic production tax credits for key components and equipment such as solar, wind and secondary batteries, and by designating small modular reactors as national strategic technologies. South Korea in August unveiled projections for commercial renewable capacity to reach 220GW by 2040 , reflecting a sharp increase in projected power demand. Solar is set to lead the expansion, with capacity expected to reach 155GW by 2040, compared with 61GW for wind. But reaching 220GW by 2040 would be challenging, according to market participants, given renewable capacity has increased by only around 3-4GW/yr in recent years. The rapid expansion of intermittent renewables could also place more operational pressure on power plants and increase reliance on fossil fuel generation to balance fluctuations in output. South Korea raised coal-fired output during the peak summer demand period, although it reduced its gas-fired power generation. The higher coal-fired output was attributed to more frequent ramp-ups and ramp-downs at power plants to coincide with lower solar output days, its main generation type competitor in grid dispatch. By Prethika Nair Send comments and request more information at feedback@argusmedia.com Copyright © 2026. Argus Media group . All rights reserved.