European gas prices drop to Henry Hub floor

  • Spanish Market: Natural gas
  • 08/04/20

European front-month gas prices have in recent days fallen to levels at which US LNG exports would no longer be profitable.

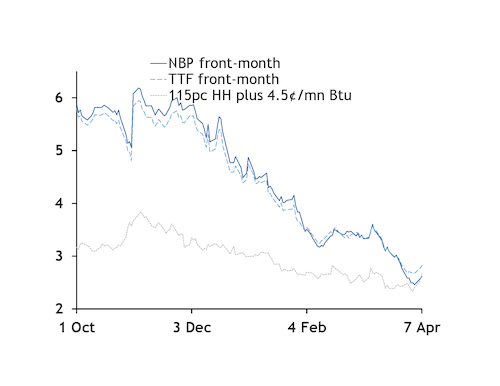
The NBP front-month market yesterday moved down to a premium to the US' Henry Hub that would no longer be wide enough to cover the variable costs of shipping US LNG cargoes to northwest Europe, even for firms that have sunk costs along the entire route. And TTF front-month prices have closed in on that support level.

Cheniere charges offtakers at its 25mn t/yr Sabine Pass and 10mn t/yr Corpus Christi facilities feedgas costs valued at 115pc of the final Nymex Henry Hub settlement for the month in which a cargo is loaded. Other variable costs could be as little as $0.04-0.05/mn Btu this summer for firms that own assets along the value chain and have long-term booked transport and regasification capacity that can be considered sunk costs, and would only have to factor in fuel costs.

The NBP front-month market held a tighter premium to the Henry Hub than these variable fees yesterday for the first time (see European gas prices vs Henry Hub graph). And the TTF front-month contract held just $0.15/mn Btu above this support level.

And firms without sunk shipping costs would have significantly higher variable fees. The NBP front-month market closed yesterday as much as $0.31/mn Btu below the level at which there would no longer be an incentive to ship a US cargo to the UK once factoring in the Argus Round Voyage freight costs between the US Gulf coast and Milford Haven.

The cost of feedgas may be lower for Cheniere, possibly ranging from 107-109pc of Henry Hub, market participants have said. NBP front-month prices were yesterday at a premium to Henry Hub that was slightly too wide to discourage US LNG from arriving after applying a 108pc formula and adding on $0.04-0.05/mn Btu in variable costs.

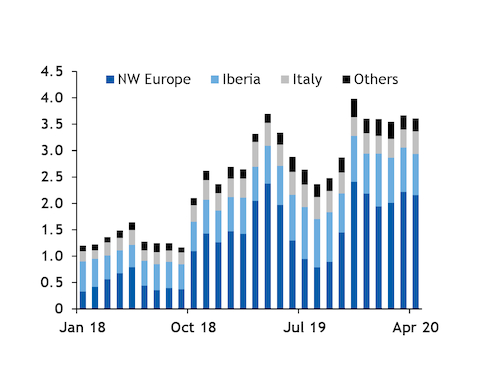
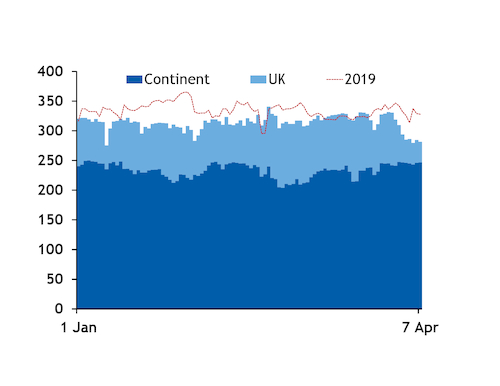
US LNG production could be shut in if there is little incentive for exports to Europe, which has soaked up the majority of US LNG cargoes in recent months and has mostly been a more profitable destination than northeast Asia (see European sendout graph).

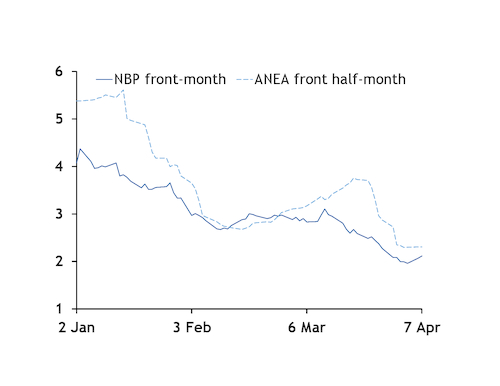
Northeast Asian delivered LNG markets and European hub prices have chased each other lower in recent weeks, with demand in both regions having been hit heavily by measures aimed at curbing the spread of Covid-19 (see NBP vs ANEA graph).

ANEA near-curve prices had slid enough in late March-early April to discourage US cargoes from heading to the Pacific basin, following the start of a 21-day national lockdown in India from 25 March.

But European gas prices have since fallen faster than ANEA markets, with gas-intensive industrial output down especially sharply in southern Europe. Emerging demand from Asian buyers for June deliveries has also lent support to ANEA June prices in recent days. The ANEA June price yesterday held just enough of a premium to northwest European LNG prices for delivery in the first half of May to attract US cargoes.

Various firms had foreseen Henry Hub plus variable costs acting as a floor for European gas prices in the coming years.

Gas delivered to Europe in the coming years will be priced according to the Henry Hub rather than oil-indexed with the option of halting some US LNG output if there is little incentive for exports, BP's Russia and CIS economics chief, Vladimir Drebentsov, said in 2017. The convergence of NBP, Henry Hub and Asian spot LNG prices will continue in the coming years as US liquefaction capacity grows, Drebentsov had said.

But global gas prices may have to hold below the Henry Hub for a prolonged period to provide an incentive for some production capacity to be mothballed for commercial reasons, partly because of logistical problems of turning off US liquefaction capacity.

Cheniere said in February that customers cancelled two April loadings because of low global LNG prices, with both cargoes cancelled by Spain's Endesa.

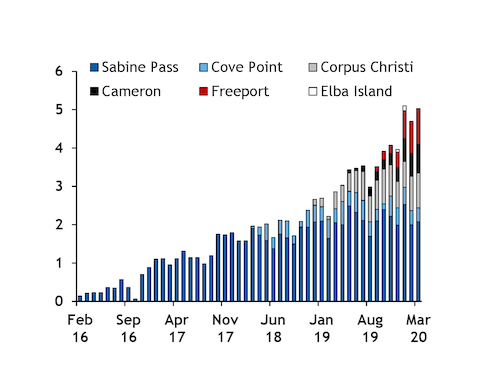
But US LNG exports did not slow in March despite the sharp drop in global prices, suggesting that significant volumes were not cancelled for this month (see US LNG exports graph). Offtakers would have lost more money by cancelling cargoes than potentially selling them at a loss.

US LNG exports could still slow this month, with one of Sabine Pass's five liquefaction trains likely to be off line for maintenance judging by a drop in feedgas since 3 April.

Europe needs significant supply-side responses

Europe will struggle to absorb all its supply this summer without firms using their available flexibility to reduce supply, with most of the scope to make demand-side reductions used up last summer.

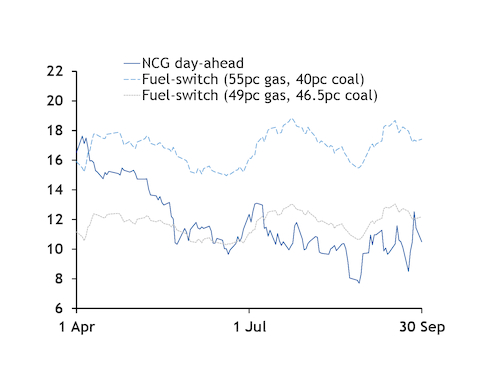
Even before the slide in weather-adjusted consumption following the coronavirus outbreak, Europe was set to enter the summer with even weaker injection demand than a year earlier. And the region had already exhausted almost all its demand-side flexibility last summer by burning more gas in the power sector and lifting storage inventories to or even above nameplate capacity in some regions (see fuel-switching graph).

The full displacement of base-load coal and lignite-fired generation could create some extra demand this summer, especially as some coal-fired plants have been mothballed, including German units operated by RWE and Steag. But long-term power hedges locking in coal-fired generation may limit the switch to gas from coal and lignite.

And Ukraine could provide an extra outlet for Europe's spare supply given ample unused storage capacity.

But this will have to be accompanied by a significant turndown in Europe's LNG and pipeline imports from a year earlier.

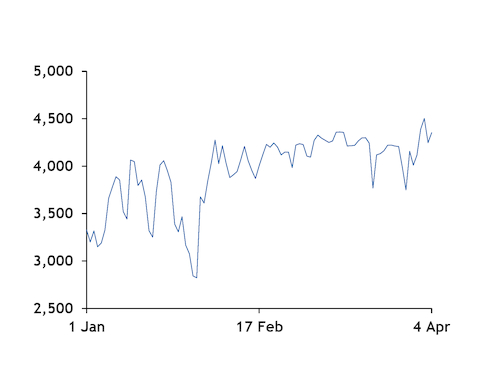
Norwegian pipeline flows to the UK have already dropped early this month close to their contractual minimum, with NBP prompt prices partly disconnecting from continental hubs and holding well below the summer 2021 contract (see Norwegian flows graph). State-controlled Equinor has likely turned down output from its flexible Troll and Oseberg fields.

But Russian state-controlled Gazprom's pipeline deliveries to Europe, excluding the Baltic states, and Turkey have risen early this month (see Russian flows graph).

Continental fuel-switching largely exhausted last summer €/MWh

US LNG exports hold in March mn t

Russian pipeline flows to Europe rise GWh/d

European LNG sendout stays quick TWh/d

ANEA, NBP prices chase each other lower $/mn Btu

European prices fall to Henry Hub floor $/mn Btu

Norwegian deliveries to Europe slide mn m³/d

Related news posts

Argus illuminates the markets by putting a lens on the areas that matter most to you. The market news and commentary we publish reveals vital insights that enable you to make stronger, well-informed decisions. Explore a selection of news stories related to this one.

03/05/24

Brazil hydroelectric dam bursts under record rains

Brazil hydroelectric dam bursts under record rains

Sao Paulo, 3 May (Argus) — Brazilian power generation company Companhia Energetica Rio das Antas (Ceran) found a partial rupture in its 100MW 14 de Julho hydroelectric plant following record precipitation in Rio Grande do Sul state. Flooding from the record rains has left 37 dead and forced more than 23,000 people out of their homes, causing widespread damage across the state, including washed out bridges and roads across several cities. Ceron reported that the dam of the hydroelectric plant on the Antas River suffered a rupture under the heavy rains and the company implemented an emergency evacuation plan on 1 May. Ceron's 130MW Monte Claro and 130MW Castro Alves plants are under intense monitoring, the company said in a statement. Rio Grande do Sul state governor Eduardo Leite declared a state of emergency and the federal government promised to release funding for emergency disaster relief. Leite said the flooding will likely go down as the worst environmental disaster in the state's history. Brazil's southernmost state along the border with Argentina has been punished by record precipitation over the past year owing to the effects of the strong El Nino weather phenomenon, according to Rio Grande do Sul-based weather forecaster MetSul Meteorologia. Brazilian power company CPFL Energia controls Ceran with a 65pc equity stake. Energy company CEEE-GT, which is owned by steel manufacturer CSN, owns another 30pc, and Norway's Statkraft owns the remaining 5pc. The state had declared a state of emergency as recently as September 2023 because of unusually heavy rains that resulted in the death of more than 30 people. Weather forecasters expect El Nino conditions to abate in the coming months over the eastern Pacific. Send comments and request more information at feedback@argusmedia.com Copyright © 2024. Argus Media group . All rights reserved.

Chevron’s oily DJ basin buy boosts gas output


03/05/24
03/05/24

Chevron’s oily DJ basin buy boosts gas output

New York, 3 May (Argus) — Chevron's US natural gas production has surged in recent quarters due to its crude-focused acquisition of Denver-based PDC Energy last August, increasing the oil major's exposure to the US gas market months after that market entered an extended price slump. Chevron's US gas production in the first quarter was 2.7 Bcf/d (76mn m3/d), up by 53pc from the year-earlier quarter and the highest since at least 2021, according to company production data. Chevron's total US output rose by 35pc year-over-year to 1.57 b/d of oil equivalent (boe/d), while US crude output increased by 21pc to 779,000 b/d. The acreage Chevron picked up last year in the DJ basin of northeast Colorado and southeast Wyoming has higher gas-oil ratios than the rest of its US portfolio. Chevron mostly focuses US production in the crude-rich Permian basin of west Texas and southeast New Mexico. Since Chevron closed its acquisition of PDC on 7 August, US gas prices have mostly languished in loss-making territory. Prompt-month Nymex gas settlements at the US benchmark Henry Hub from 7 August 2023 to 2 May 2024 averaged $2.46/mmBtu, down from an average of $4.999/mmBtu in the year-earlier period. In a May 2023 conference call over Chevron's acquisition of PDC, chief executive Mike Wirth expressed optimism for the long-run outlook for natural gas, despite the more immediately dim outlook. "There's going to be stronger global demand for gas growth than there will be for oil over the next decade and beyond as the world looks to decarbonize," Wirth said. Despite lower US gas prices, Chevron has captured $600mn in cost savings from the PDC acquisition between capital and operational expenditures, the company told Argus . Crude prices have also been more resilient. Chevron's profit in the first quarter was $5.5bn, down from $6.6bn in the year-earlier quarter, partly due to lower gas prices. US gas prices have been lower this year as unseasonably warm winter weather and resilient production have created an oversupplied US gas market. A government report Thursday showed US gas inventories up by 35pc from the five-year average. By Julian Hast Send comments and request more information at feedback@argusmedia.com Copyright © 2024. Argus Media group . All rights reserved.

US job growth nearly halved in April: Update


03/05/24
03/05/24

US job growth nearly halved in April: Update

Adds services PMI in first, fifth paragraphs, factory PMI reference in sixth paragraph. Houston, 3 May (Argus) — The US added fewer jobs in April as the unemployment rate ticked up and average earnings growth slowed, signs of gradually weakening labor market conditions. A separate survey showed the services sector contracted last month. The US added 175,000 jobs in April, the Labor Department reported today, fewer than the 238,000 analysts anticipated. That compared with an upwardly revised 315,000 jobs in March and a downwardly revised 236,000 jobs in February. The unemployment rate ticked up to 3.9pc from 3.8pc. The unemployment rate has ranged from 3.7-3.9pc since August 2023, near the five-decade low of 3.4pc. The latest employment report comes after the Federal Reserve on Wednesday held its target lending rate unchanged for a sixth time and signaled it would be slower in cutting rates from two-decade highs as the labor market has remained "strong" and inflation, even while easing, is "still too high". US stocks opened more than 1pc higher today after the jobs report and the yield on the 10-year Treasury note fell to 4.47pc. Futures markets showed odds of a September rate cut rose by about 10 percentage points to about 70pc after the report. Services weakness Another report today showed the biggest segment of the economy contracted last month. The Institute for Supply Management's (ISM) services purchasing managers index (PMI) fell to 49.4 in April from 51.4 in March, ending 15 months of expansion. The services PMI employment index fell to 45.9, the fourth contraction in five months, in today's report. Readings below 50 signal contraction. On 1 May, ISM reported that the manufacturing PMI fell to 49.2 in April, after one month of growth following 16 months of contraction. In today's employment report from the Labor Department, average hourly earnings grew by 3.9pc over the 12 month period, down from 4.1pc in the period ended in March. Job gains in the 12 months through March averaged 242,000. Gains, including revisions, averaged 276,000 in the prior three-month period. Job gains occurred in health care, social services and transportation and warehousing. Health care added 56,000 jobs, in line with the gains over the prior 12 months. Transportation and warehousing added 22,000, also near the 12-month average. Retail trade added 20,000. Construction added 9,000 following 40,000 in March. Government added 8,000, slowing from an average of 55,000 in the prior 12 months. Manufacturing added 9,000 jobs after posting 4,000 jobs the prior month. Mining and logging lost 3,000 jobs. By Bob Willis Send comments and request more information at feedback@argusmedia.com Copyright © 2024. Argus Media group . All rights reserved.

Austrian regulator consults on gas tariff changes


03/05/24
03/05/24

Austrian regulator consults on gas tariff changes

London, 3 May (Argus) — Austrian energy regulator E-Control has revised up its planned increase in gas tariffs from the start of 2025 but adjusted its commodity charge lower. E-Control on Friday published draft amendments to its gas system charges ordinance that would codify planned changes to how it calculates tariffs. It largely retains its revised methodology from April, but has modified its planned outright tariffs and commodity charge. The regulator had in February proposed a shift to a capacity-weighted distance (CWD) model for its reference price methodology, along with a change to a 50:50 entry-exit revenue split from roughly 20:80 at present. The proposed changes would have tripled entry costs from Germany and quadrupled them from Italy from 2025, as well as other significant changes for the distribution system and storages. Austria's system operators supported the changes , but almost all other respondents to the consultation were highly critical , warning that the changes could threaten diversification, lower utilisation and increase tariffs further and harm liquidity. E-Control last month walked back on several of the proposed changes . Most significantly, it revised the entry-exit split to 25:75, limited the increase in exit tariffs to the distribution zone, introduced a 50pc discount on exit fees to storage facilities, and equalised entry tariffs at all points. The switch to a CWD model was retained, however. The most notable modification from the changes proposed in April is a roughly 7pc increase in capacity-based tariffs, as the new amendments use final prices as opposed to indicative prices previously (see table) . The difference "results from the findings over the course of the cost approval procedure during the past few months", E-Control told Argus . In contrast, the commodity charge on gas entering and exiting the Austrian grid has decreased as a result of "lower expected fuel energy costs", E-Control told Argus . It now plans to charge around €0.04/MWh on entry flows and €0.13/MWh on exit flows, compared with €0.12/MWh and €0.13/MWh, respectively, in the original proposal. There is no commodity charge in place for this year. The final change is an update of the multipliers for capacity bookings depending on their duration. The regulator now proposes multipliers of 1.25 for quarterly products, 1.5 for monthly, two for daily, and three for within-day. Interested parties may submit comments to the regulator by 16 May. Final tariffs will then be published in June, and will be applicable from 1 January 2025. By Brendan A'Hearn Austria 2025-28 estimated tariffs €/kWh/h/a Entry/Exit Capacity type* 2025 (final) 2026 (preliminary) 2027 (preliminary) Baumgarten Entry FZK 1.30 1.37 1.48 Oberkappel Entry FZK 1.30 1.37 1.48 Uberackern Entry FZK 1.30 1.37 1.48 Uberackern Entry DZK 1.17 1.23 1.33 Uberackern Exit FZK 4.25 4.59 4.98 Uberackern Exit DZK 3.82 4.13 4.48 Arnoldstein Entry FZK 1.30 1.37 1.48 Arnoldstein Entry DZK 1.17 1.23 1.33 Arnoldstein Exit FZK 5.96 6.62 7.39 Murfeld Exit FZK 3.73 4.19 4.71 Mosonmagyarovar Exit FZK 2.15 2.49 2.80 Distribution area Exit FZK 1.26 1.45 1.67 Storage Penta West Exit FZK 2.12 2.29 2.49 Storage MAB Exit FZK 1.07 1.19 1.34 *FZK = Firm, freely allocable capacity; DZK = dynamically allocable capacity — E-Control Austria 2025 final tariff vs current €/kWh/h/a Entry/Exit Capacity type* 2025 Current ±% Baumgarten Entry FZK 1.30 0.85 53 Oberkappel Entry FZK 1.30 0.97 34 Uberackern Entry FZK 1.30 0.97 34 Uberackern Entry DZK 1.17 0.88 33 Uberackern Exit FZK 4.25 3.26 30 Uberackern Exit DZK 3.82 2.93 31 Arnoldstein Entry FZK 1.30 0.97 33 Arnoldstein Entry DZK 1.17 0.68 72 Arnoldstein Exit FZK 5.96 4.35 37 Murfeld Exit FZK 3.73 1.90 97 Mosonmagyarovar Exit FZK 2.15 1.23 75 Distribution area Exit FZK 1.26 0.42 200 Storage Penta West Exit FZK 2.12 0.44 383 Storage MAB Exit FZK 1.07 0.44 144 *FZK = firm, freely allocable capacity; DZK = dynamically allocable capacity — E-Control Send comments and request more information at feedback@argusmedia.com Copyright © 2024. Argus Media group . All rights reserved.

US job growth nearly halved in April


03/05/24
03/05/24

US job growth nearly halved in April

Houston, 3 May (Argus) — The US added fewer jobs in April as the unemployment rate ticked up and average earnings growth fell, signs of gradually weakening labor market conditions. The US added 175,000 jobs in April, the Labor Department reported today, fewer than the 238,000 analysts anticipated. That compared with an upwardly revised 315,000 jobs in March and a downwardly revised 236,000 jobs in February. The unemployment rate ticked up to 3.9pc from 3.8pc. The unemployment rate has ranged from 3.7-3.9pc since August 2023, near the five-decade low of 3.4pc. The latest employment report comes after the Federal Reserve on Wednesday held its target lending rate unchanged for a sixth time and signaled it would be slower in cutting rates from two-decade highs as the labor market has remained "strong" and inflation, even while easing, is "still too high". US stocks opened more than 1pc higher today after the jobs report and the yield on the 10-year Treasury note fell to 4.47pc. Futures markets showed odds of a September rate cut rose by about 10 percentage points to about 70pc after the report. Average hourly earnings grew by 3.9pc over the 12 month period, down from 4.1pc in the period ended in March. Job gains in the 12 months through March averaged 242,000. Gains, including revisions, averaged 276,000 in the prior three-month period. Job gains occurred in health care, social services and transportation and warehousing. Health care added 56,000 jobs, in line with the gains over the prior 12 months. Transportation and warehousing added 22,000, also near the 12-month average. Retail trade added 20,000. Construction added 9,000 following 40,000 in March. Government added 8,000, slowing from an average of 55,000 in the prior 12 months. Manufacturing added 9,000 jobs after posting 4,000 jobs the prior month. Mining and logging lost 3,000 jobs. By Bob Willis Send comments and request more information at feedback@argusmedia.com Copyright © 2024. Argus Media group . All rights reserved.

Business intelligence reports

Get concise, trustworthy and unbiased analysis of the latest trends and developments in oil and energy markets. These reports are specially created for decision makers who don’t have time to track markets day-by-day, minute-by-minute.

Learn more