Australia's iron ore exports continued to rise in September, driven by higher shipments to China.
Australia exported 80.09mn t of iron ore in September, up by 5.4pc from the revised figure of 75.97mn t in August and up by 8.6pc from a year earlier, according to data from the Australian Bureau of Statistics (ABS) supplied through GTT.
Australia's shipments to China stood at 69.72mn t in September, up by 7.6pc on the month and by 10.8pc on the year. China accounted for 87pc of Australia's total exports in September, up from 85.5pc in August and 85.3pc from a year earlier.
Iron ore shipments from Australia's four major iron ore producers hit a record high in mid-September since June. Although shipments eased in the remaining month, they were still 5pc above the 12-month weekly average.
Over January-September, Australia's iron ore exports stood at 673.90mn t, up by 1.7pc from a year earlier. Australia exported a total of 19.94mn t of lump and 59.92mn t of fines to all destinations in September, up from 18.50mn t of lump and 56mn t of fines in August.
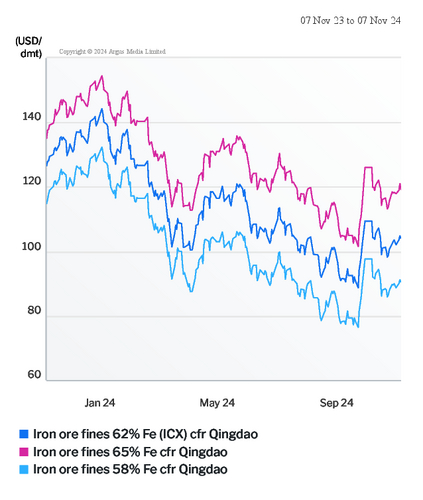
The Argus ICX seaborne fines price for 62pc Fe ore delivered to China averaged $93.92/dry metric tonne (dmt) cfr Qingdao in September, down from $98.85/dmt in August and $120.53/dmt in September 2023. Despite September usually being a peak season for steel demand, weaker-than-expected demand in China dampened steel and iron ore prices.
A series of economic stimulus policies announced by China in the last week of September supported prices, with the Argus-assessed ICX iron ore index standing at $109.35/dmt cfr Qingdao on a 62pc Fe basis and 58pc Fe at $97.65/dmt cfr Qingdao on 30 September.
But they have fallen since then, with Argus last assessing them on 6 November at $104.10/dmt cfr Qingdao on a 62pc Fe basis and at $90.50/dmt cfr Qingdao on a 58pc Fe basis.
| Australian iron ore exports | (mn t) | ||||
| Destination | Sep | % ± vs Aug | % ± vs Sep '23 | FY2024 | % ± vs FY2023 |
| China (excluding SARs and Taiwan) | 69.7 | 7.6 | 10.8 | 571.8 | 2 |
| Japan | 4.2 | 3.9 | 10.9 | 38.4 | -3.4 |
| South Korea | 4.1 | 2.4 | -3.9 | 37.4 | 1.4 |
| Taiwan | 1 | -4.8 | -13.5 | 9.2 | -5.8 |
| Vietnam | 0.7 | -0.3 | 1.2 | 7.5 | 0.2 |
| Total | 80.1 | 5.4 | 8.6 | 673.9 | 1.7 |
| Source: ABS, GTT | |||||