European LNG sendout slips in June

  • Market: Natural gas
  • 07/07/20

Europe's LNG sendout stepped down in June from a year earlier, driven largely by northwest Europe, but has recovered slightly so far this month.

Combined European sendout fell to 2.46 TWh/d in June from 2.88 TWh/d a year earlier, and was also slower than in May. It was the lowest for any month since August 2019.

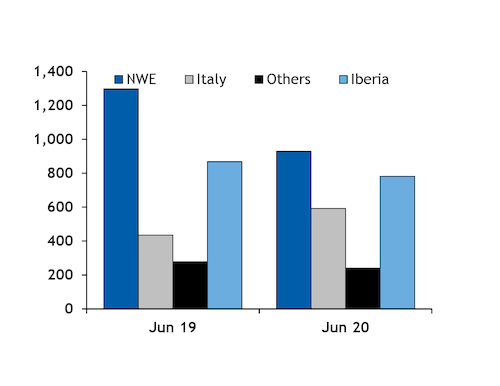
The decrease was driven mostly by slower sendout across northwest Europe. Combined UK, Belgian, Dutch and French sendout fell to 929 GWh/d from 1.3 TWh/d in June last year and was well below the 2.1 TWh/d recorded in May.

Low European injection demand and a fall in power-sector gas demand on the year may have curtailed Europe's ability to absorb strong LNG sendout last month. Combined power-sector gas demand in France, Germany, Belgium, Italy, the Netherlands, Spain and the UK edged down to about 2.3 TWh/d in June from 2.31 TWh/d in June last year.

And low gas demand globally in the wake of the Covid-19 pandemic eventually forced a supply-side response, particularly from the US, with June loadings down considerably. This tightened supply availability in the Atlantic basin for delivery to Europe.

Sendout fell the most in France and the Netherlands, offset only partly by a rebound in UK regasification.

The UK received eight cargoes last month, up from five a year earlier, and most were directed to the 15.6mn t/yr South Hook terminal.

Demand remained largely muted across northeast Asia, with economies slowly recovering from the outbreak. And South Hook has an agreement with Qatari state-owned Qatargas to receive deliveries when a more profitable destination cannot be found, resulting in the UK facility acting as terminal of last resort for Qatari LNG.

Sendout fell more in France than in any other European country, to 289 GWh/d from 671 GWh/d a year earlier. Deliveries to the regulated terminals slipped to six from 12 a year earlier.

France was less able to absorb strong supply in June than in April-May because of high underground stocks, with brisk LNG receipts earlier in the summer having driven a quick stockbuild.

The drop in LNG sendout elsewhere in Europe was less pronounced.

Iberian sendout — combining Portugal and Spain — slipped to 782 GWh/d from 860 GWh/d a year earlier. Portuguese sendout was up on the year, more than offset by a drop in Spanish regasification. But as opposed to other countries, Iberian regasification accelerated from May as increased consumption lifted the scope to raise sendout. High daytime temperatures in the region boosted electricity demand for cooling purposes, while the end of the countries' lockdowns bolstered consumption further.

And Italian sendout edged up to 440 GWh/d last month from 434 GWh/d a year earlier. LNG imports were up, even as temperature-adjusted consumption stayed low in the wake of the pandemic.

But Italy may have limited capacity to receive further strong imports in the coming months. The stockbuild was particularly quick in April-May, and while it slipped below average last month, inventories have remained well above recent-year averages.

LNG sendout rebounds in early July

Europe's LNG sendout has started to rebound in recent days, but potential for sustained quick regasification could depend partly on how much more demand can recover in the coming weeks.

Combined European sendout averaged 2.6 TWh/d on 1-6 July, about 135 GWh/d higher than in all of June.

A rise in European prompt prices may have increased the incentive for firms to regasify their supply.

But Europe may not be able to absorb any further increase in regasification in the coming weeks, amid limited spare capacity in continental storage facilities.

And demand across Europe could remain muted for the rest of this year. The European Commission expects EU-27 real GDP to shrink by 8.3pc this year and increase by 5.8pc next year, assuming there is no second wave of Covid-19 infections. But fresh outbreaks have already been reported across the continent, prompting new lockdowns, such as in Spain's Galicia and Catalonia regions.

LNG sendout from selected regions GWh/d

Sharelinkedin-sharetwitter-sharefacebook-shareemail-share

Related news posts

Argus illuminates the markets by putting a lens on the areas that matter most to you. The market news and commentary we publish reveals vital insights that enable you to make stronger, well-informed decisions. Explore a selection of news stories related to this one.

News
03/05/24

Brazil hydroelectric dam bursts under record rains

Brazil hydroelectric dam bursts under record rains

Sao Paulo, 3 May (Argus) — Brazilian power generation company Companhia Energetica Rio das Antas (Ceran) found a partial rupture in its 100MW 14 de Julho hydroelectric plant following record precipitation in Rio Grande do Sul state. Flooding from the record rains has left 37 dead and forced more than 23,000 people out of their homes, causing widespread damage across the state, including washed out bridges and roads across several cities. Ceron reported that the dam of the hydroelectric plant on the Antas River suffered a rupture under the heavy rains and the company implemented an emergency evacuation plan on 1 May. Ceron's 130MW Monte Claro and 130MW Castro Alves plants are under intense monitoring, the company said in a statement. Rio Grande do Sul state governor Eduardo Leite declared a state of emergency and the federal government promised to release funding for emergency disaster relief. Leite said the flooding will likely go down as the worst environmental disaster in the state's history. Brazil's southernmost state along the border with Argentina has been punished by record precipitation over the past year owing to the effects of the strong El Nino weather phenomenon, according to Rio Grande do Sul-based weather forecaster MetSul Meteorologia. Brazilian power company CPFL Energia controls Ceran with a 65pc equity stake. Energy company CEEE-GT, which is owned by steel manufacturer CSN, owns another 30pc, and Norway's Statkraft owns the remaining 5pc. The state had declared a state of emergency as recently as September 2023 because of unusually heavy rains that resulted in the death of more than 30 people. Weather forecasters expect El Nino conditions to abate in the coming months over the eastern Pacific. Send comments and request more information at feedback@argusmedia.com Copyright © 2024. Argus Media group . All rights reserved.

Find out more
News

Chevron’s oily DJ basin buy boosts gas output


03/05/24
News
03/05/24

Chevron’s oily DJ basin buy boosts gas output

New York, 3 May (Argus) — Chevron's US natural gas production has surged in recent quarters due to its crude-focused acquisition of Denver-based PDC Energy last August, increasing the oil major's exposure to the US gas market months after that market entered an extended price slump. Chevron's US gas production in the first quarter was 2.7 Bcf/d (76mn m3/d), up by 53pc from the year-earlier quarter and the highest since at least 2021, according to company production data. Chevron's total US output rose by 35pc year-over-year to 1.57 b/d of oil equivalent (boe/d), while US crude output increased by 21pc to 779,000 b/d. The acreage Chevron picked up last year in the DJ basin of northeast Colorado and southeast Wyoming has higher gas-oil ratios than the rest of its US portfolio. Chevron mostly focuses US production in the crude-rich Permian basin of west Texas and southeast New Mexico. Since Chevron closed its acquisition of PDC on 7 August, US gas prices have mostly languished in loss-making territory. Prompt-month Nymex gas settlements at the US benchmark Henry Hub from 7 August 2023 to 2 May 2024 averaged $2.46/mmBtu, down from an average of $4.999/mmBtu in the year-earlier period. In a May 2023 conference call over Chevron's acquisition of PDC, chief executive Mike Wirth expressed optimism for the long-run outlook for natural gas, despite the more immediately dim outlook. "There's going to be stronger global demand for gas growth than there will be for oil over the next decade and beyond as the world looks to decarbonize," Wirth said. Despite lower US gas prices, Chevron has captured $600mn in cost savings from the PDC acquisition between capital and operational expenditures, the company told Argus . Crude prices have also been more resilient. Chevron's profit in the first quarter was $5.5bn, down from $6.6bn in the year-earlier quarter, partly due to lower gas prices. US gas prices have been lower this year as unseasonably warm winter weather and resilient production have created an oversupplied US gas market. A government report Thursday showed US gas inventories up by 35pc from the five-year average. By Julian Hast Send comments and request more information at feedback@argusmedia.com Copyright © 2024. Argus Media group . All rights reserved.

News

US job growth nearly halved in April: Update


03/05/24
News
03/05/24

US job growth nearly halved in April: Update

Adds services PMI in first, fifth paragraphs, factory PMI reference in sixth paragraph. Houston, 3 May (Argus) — The US added fewer jobs in April as the unemployment rate ticked up and average earnings growth slowed, signs of gradually weakening labor market conditions. A separate survey showed the services sector contracted last month. The US added 175,000 jobs in April, the Labor Department reported today, fewer than the 238,000 analysts anticipated. That compared with an upwardly revised 315,000 jobs in March and a downwardly revised 236,000 jobs in February. The unemployment rate ticked up to 3.9pc from 3.8pc. The unemployment rate has ranged from 3.7-3.9pc since August 2023, near the five-decade low of 3.4pc. The latest employment report comes after the Federal Reserve on Wednesday held its target lending rate unchanged for a sixth time and signaled it would be slower in cutting rates from two-decade highs as the labor market has remained "strong" and inflation, even while easing, is "still too high". US stocks opened more than 1pc higher today after the jobs report and the yield on the 10-year Treasury note fell to 4.47pc. Futures markets showed odds of a September rate cut rose by about 10 percentage points to about 70pc after the report. Services weakness Another report today showed the biggest segment of the economy contracted last month. The Institute for Supply Management's (ISM) services purchasing managers index (PMI) fell to 49.4 in April from 51.4 in March, ending 15 months of expansion. The services PMI employment index fell to 45.9, the fourth contraction in five months, in today's report. Readings below 50 signal contraction. On 1 May, ISM reported that the manufacturing PMI fell to 49.2 in April, after one month of growth following 16 months of contraction. In today's employment report from the Labor Department, average hourly earnings grew by 3.9pc over the 12 month period, down from 4.1pc in the period ended in March. Job gains in the 12 months through March averaged 242,000. Gains, including revisions, averaged 276,000 in the prior three-month period. Job gains occurred in health care, social services and transportation and warehousing. Health care added 56,000 jobs, in line with the gains over the prior 12 months. Transportation and warehousing added 22,000, also near the 12-month average. Retail trade added 20,000. Construction added 9,000 following 40,000 in March. Government added 8,000, slowing from an average of 55,000 in the prior 12 months. Manufacturing added 9,000 jobs after posting 4,000 jobs the prior month. Mining and logging lost 3,000 jobs. By Bob Willis Send comments and request more information at feedback@argusmedia.com Copyright © 2024. Argus Media group . All rights reserved.

News

Austrian regulator consults on gas tariff changes


03/05/24
News
03/05/24

Austrian regulator consults on gas tariff changes

London, 3 May (Argus) — Austrian energy regulator E-Control has revised up its planned increase in gas tariffs from the start of 2025 but adjusted its commodity charge lower. E-Control on Friday published draft amendments to its gas system charges ordinance that would codify planned changes to how it calculates tariffs. It largely retains its revised methodology from April, but has modified its planned outright tariffs and commodity charge. The regulator had in February proposed a shift to a capacity-weighted distance (CWD) model for its reference price methodology, along with a change to a 50:50 entry-exit revenue split from roughly 20:80 at present. The proposed changes would have tripled entry costs from Germany and quadrupled them from Italy from 2025, as well as other significant changes for the distribution system and storages. Austria's system operators supported the changes , but almost all other respondents to the consultation were highly critical , warning that the changes could threaten diversification, lower utilisation and increase tariffs further and harm liquidity. E-Control last month walked back on several of the proposed changes . Most significantly, it revised the entry-exit split to 25:75, limited the increase in exit tariffs to the distribution zone, introduced a 50pc discount on exit fees to storage facilities, and equalised entry tariffs at all points. The switch to a CWD model was retained, however. The most notable modification from the changes proposed in April is a roughly 7pc increase in capacity-based tariffs, as the new amendments use final prices as opposed to indicative prices previously (see table) . The difference "results from the findings over the course of the cost approval procedure during the past few months", E-Control told Argus . In contrast, the commodity charge on gas entering and exiting the Austrian grid has decreased as a result of "lower expected fuel energy costs", E-Control told Argus . It now plans to charge around €0.04/MWh on entry flows and €0.13/MWh on exit flows, compared with €0.12/MWh and €0.13/MWh, respectively, in the original proposal. There is no commodity charge in place for this year. The final change is an update of the multipliers for capacity bookings depending on their duration. The regulator now proposes multipliers of 1.25 for quarterly products, 1.5 for monthly, two for daily, and three for within-day. Interested parties may submit comments to the regulator by 16 May. Final tariffs will then be published in June, and will be applicable from 1 January 2025. By Brendan A'Hearn Austria 2025-28 estimated tariffs €/kWh/h/a Entry/Exit Capacity type* 2025 (final) 2026 (preliminary) 2027 (preliminary) Baumgarten Entry FZK 1.30 1.37 1.48 Oberkappel Entry FZK 1.30 1.37 1.48 Uberackern Entry FZK 1.30 1.37 1.48 Uberackern Entry DZK 1.17 1.23 1.33 Uberackern Exit FZK 4.25 4.59 4.98 Uberackern Exit DZK 3.82 4.13 4.48 Arnoldstein Entry FZK 1.30 1.37 1.48 Arnoldstein Entry DZK 1.17 1.23 1.33 Arnoldstein Exit FZK 5.96 6.62 7.39 Murfeld Exit FZK 3.73 4.19 4.71 Mosonmagyarovar Exit FZK 2.15 2.49 2.80 Distribution area Exit FZK 1.26 1.45 1.67 Storage Penta West Exit FZK 2.12 2.29 2.49 Storage MAB Exit FZK 1.07 1.19 1.34 *FZK = Firm, freely allocable capacity; DZK = dynamically allocable capacity — E-Control Austria 2025 final tariff vs current €/kWh/h/a Entry/Exit Capacity type* 2025 Current ±% Baumgarten Entry FZK 1.30 0.85 53 Oberkappel Entry FZK 1.30 0.97 34 Uberackern Entry FZK 1.30 0.97 34 Uberackern Entry DZK 1.17 0.88 33 Uberackern Exit FZK 4.25 3.26 30 Uberackern Exit DZK 3.82 2.93 31 Arnoldstein Entry FZK 1.30 0.97 33 Arnoldstein Entry DZK 1.17 0.68 72 Arnoldstein Exit FZK 5.96 4.35 37 Murfeld Exit FZK 3.73 1.90 97 Mosonmagyarovar Exit FZK 2.15 1.23 75 Distribution area Exit FZK 1.26 0.42 200 Storage Penta West Exit FZK 2.12 0.44 383 Storage MAB Exit FZK 1.07 0.44 144 *FZK = firm, freely allocable capacity; DZK = dynamically allocable capacity — E-Control Send comments and request more information at feedback@argusmedia.com Copyright © 2024. Argus Media group . All rights reserved.

News

US job growth nearly halved in April


03/05/24
News
03/05/24

US job growth nearly halved in April

Houston, 3 May (Argus) — The US added fewer jobs in April as the unemployment rate ticked up and average earnings growth fell, signs of gradually weakening labor market conditions. The US added 175,000 jobs in April, the Labor Department reported today, fewer than the 238,000 analysts anticipated. That compared with an upwardly revised 315,000 jobs in March and a downwardly revised 236,000 jobs in February. The unemployment rate ticked up to 3.9pc from 3.8pc. The unemployment rate has ranged from 3.7-3.9pc since August 2023, near the five-decade low of 3.4pc. The latest employment report comes after the Federal Reserve on Wednesday held its target lending rate unchanged for a sixth time and signaled it would be slower in cutting rates from two-decade highs as the labor market has remained "strong" and inflation, even while easing, is "still too high". US stocks opened more than 1pc higher today after the jobs report and the yield on the 10-year Treasury note fell to 4.47pc. Futures markets showed odds of a September rate cut rose by about 10 percentage points to about 70pc after the report. Average hourly earnings grew by 3.9pc over the 12 month period, down from 4.1pc in the period ended in March. Job gains in the 12 months through March averaged 242,000. Gains, including revisions, averaged 276,000 in the prior three-month period. Job gains occurred in health care, social services and transportation and warehousing. Health care added 56,000 jobs, in line with the gains over the prior 12 months. Transportation and warehousing added 22,000, also near the 12-month average. Retail trade added 20,000. Construction added 9,000 following 40,000 in March. Government added 8,000, slowing from an average of 55,000 in the prior 12 months. Manufacturing added 9,000 jobs after posting 4,000 jobs the prior month. Mining and logging lost 3,000 jobs. By Bob Willis Send comments and request more information at feedback@argusmedia.com Copyright © 2024. Argus Media group . All rights reserved.

Business intelligence reports

Get concise, trustworthy and unbiased analysis of the latest trends and developments in oil and energy markets. These reports are specially created for decision makers who don’t have time to track markets day-by-day, minute-by-minute.

Learn more