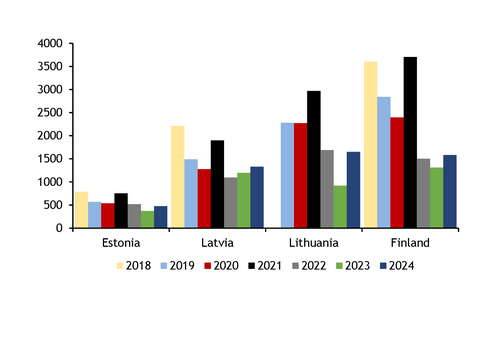
February gas consumption across all three Baltic states and Finland fell on the month, but was up on the year.
Consumption across Finland, Estonia, Latvia and Lithuania totalled 5.04TWh, down from a two-year high of 7.13TWh in January, but up by a third from 3.8TWh in February 2023 (see data and download). It was well below the 2019-21 average for the month of 7.66TWh.
Minimum temperatures for the whole month across the four capitals were 6-7°C higher than in January, reducing the call on gas for space heating and combined heat and power (CHP) generation (see temperature table). But temperatures still dropped as low as minus 24°C in Helsinki and minus 15°C in Tallinn on 1-10 February, spurring demand of 196 GWh/d, against 162 GWh/d later in the month.
Lithuania's demand was the highest of the four for the second consecutive month, although it also fell most sharply on the month — to 1.65TWh from 2.42TWh. But it was significantly higher than 1TWh a year earlier, despite milder weather.
Stronger industrial demand drove at least some of the increase. System operator Amber Grid stopped publishing data for exit flows to Jonava, where ammonia producer Achema has a large facility, in mid-February 2023. But outflows were just 4 GWh/d on 1-12 February 2023, far below capacity of around 40 GWh/d. Argus understands that Jonava is currently running at 50pc, or 20GWh/d. And Lithuanian gas-fired power output was also higher on the year, at 107MW against 23MW, although it was well down from 199MW in January.
Latvian gas-fired generation was much higher on the year, at 454MW compared with 350MW, although Finnish and Estonian output edged down (see gas-fired power table). While gas-fired generation across the four countries was up on the year, it was down by nearly 250MW on January because milder weather reduced the call on CHPs, which provide a large part of district heating.
Finnish nuclear outage to drive gas-fired output
Maintenance at Europe's largest single nuclear reactor, the 1.6GW Olkiluoto 3 (OLK3) unit in Finland, is likely to drive higher power-sector gas demand.
OLK3 was taken off line on 2 March for planned maintenance and will not return until 8 April. Finnish gas-fired power output jumped to 369MW on 2-6 March from 289MW in February, as nuclear generation dropped to 2.84GW from 4.28GW. Gas-fired output reached 509MW on Wednesday, as minimum temperatures in Helsinki dropped well below average to nearly minus 9°C, while wind generation was also particularly weak, at just 238MW.
And regional basis markets between Finland and the Baltics have been exacerbated by an outage on the 650MW Estlink 2 interconnector between Finland and Estonia, recently extended until 31 August. This puts further pressure on the Finnish system, with Finnish day-ahead prices on Nord Pool rising consistently since the start of the month. The price for delivery on Friday settled at €85.55/MWh, up from €21.82/MWh for delivery on 1 March.
The continued absence of the Balticconnector pipeline linking Finland with Estonia has also kept Finnish gas prices above those in the Baltic states. Finnish day-ahead prices for delivery on Thursday averaged €36.55/MWh on GETBaltic, well above €29.73/MWh in the joint Estonia-Latvia market.
The Finnish market's lack of flexibility was evident on 12 February, when stocks at the Inkoo LNG terminal dwindled and strong winds delayed an LNG delivery by a day, causing the system operator to warn of a potential shortage of commercial gas.
Balticconnector repairs will start this week, and the line is expected to return to service on 22 April.
| Finnish, Baltic average gas-fired power generation | MW | ||||
| Feb-24 | Feb-23 | Jan-24 | ± Feb 23 | ± Jan 24 | |
| Estonia | 5 | 7 | 6 | -2 | -1 |
| Latvia | 454 | 350 | 551 | 104 | -97 |
| Lithuania | 107 | 23 | 199 | 84 | -92 |
| Finland | 289 | 311 | 346 | -22 | -57 |
| Total | 855 | 691 | 1,102 | 164 | -247 |
| — Entso-E | |||||
| Daily average minimum temperature in FinBalt capitals | °C | |||||
| Feb-24 | Feb-23 | Jan-24 | ± yr/yr | ± m/m | 2014-23 Feb avg | |
| Vilnius | 0.34 | -2.92 | -6.51 | 3.26 | 6.85 | -3.18 |
| Riga | 0.08 | -1.34 | -6.34 | 1.42 | 6.42 | -1.89 |
| Tallinn | -2.88 | -3.00 | -8.82 | 0.12 | 5.94 | -3.12 |
| Helsinki | -6.22 | -5.80 | -12.62 | -0.42 | 6.40 | -5.26 |
| — Speedwell | ||||||