Feedgas supplies to LNG terminals dropped significantly, but overall exports fell only marginally, writes Tray Swanson
Freezing weather across the US last month resulted in firms tapping feedgas flows to liquefaction facilities and existing LNG stocks intended for exports in order to meet gas demand from domestic users — a dynamic exacerbated by a decade-long mismatch between rapidly rising LNG production and a comparative lack of growth in underground gas storage.
An arctic blast hit much of the US over 23-27 January, boosting heating demand while also causing freeze-offs at some gas production facilities. Gas suppliers drew on stocks to meet demand, marking the largest weekly storage withdrawal on record. But even this was not sufficient to rebalance the domestic market, and domestic spot prices soared to all-time highs. This led the US market to tap into its supply of last resort — gas intended for export. Gas producers and LNG exporters with the flexibility to do so were able to cede gas molecules back into the domestic market at attractive premiums.
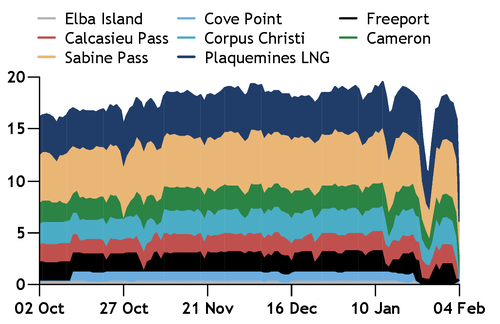
Freezing temperatures caused operational problems and production losses at upstream and midstream infrastructure, with lost output amounting to an estimated 93.2bn ft³ (2.6bn m³) over 25-31 January. Alongside this, gas demand for heating soared, leading to a record-high stockdraw of 360bn ft³ in the week ending 30 January, Energy Information Administration (EIA) data show. The stockdraw was highest in south-central US, where six operating LNG export terminals are spread across Louisiana and Texas. Withdrawals in the region reached a record-high 159bn ft³ in the week to 30 January.
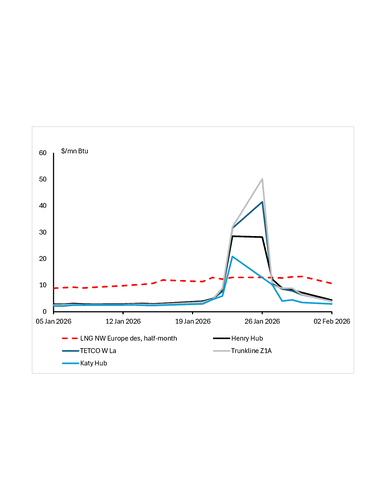
Even so, Henry Hub day-ahead prices still rose to a record high above $28/mn Btu over 23-26 January, more than double the value of spot LNG delivered to northwest Europe. Prices were even higher at nearby trading hubs, giving liquefaction capacity holders a strong incentive to sell their gas domestically. Aggregate feedgas flows to the US' eight liquefaction facilities fell by at least 7bn ft³/d, or 39pc, at the peak of the cold snap, compared with a 30-day average of 17.9bn ft³/d before temperatures plummeted. The aggregate reduction in gas available for export amounted to about 26bn ft³ in the week ending 30 January, equivalent to eight LNG cargoes.
Among Gulf coast LNG facilities, the slowdown in feedgas nominations was most pronounced at the 33mn t/yr Sabine Pass and 15mn t/yr Cameron terminals in Louisiana, and the 28.9mn t/yr Corpus Christi and 17.3mn t/yr Freeport facilities in Texas. Cheniere procures and holds title to the gas at Sabine Pass and Corpus Christi until it is loaded as LNG onto a ship, whereas Cameron and Freeport are tolling-based terminals.
For whom the bell tolls
Yet aggregate US loadings fell by only 107,000t in January compared with the previous month, and exports from Sabine Pass, Cameron and the 27.2mn t/yr Plaquemines terminal even increased on the month.
Cheniere has the advantage of significant LNG storage, with tanks capable of holding eight LNG cargoes across its two terminals. This likely allowed Cheniere to meet its contractual obligations with offtakers while also selling feedgas into the domestic market. Cheniere's feedgas supply fell by 9.8bn ft³ over 24-28 January, pipeline data show. This volume is equivalent to three LNG cargoes and could easily be offset by supplies from Cheniere's sizable storage capacity. And customers with LNG tolling arrangements have considerable flexibility because they control their gas supply and are not obligated to liquefy it.
In fact, tolling LNG terminals on the Atlantic coast not only cut their feedgas flows during the late-January freeze but they also imported cargoes. Firms in the east coast region withdrew 74bn ft³ of gas from storage in the week ending 30 January, just 2bn ft³ shy of the record set in January 2018, EIA data show. This propelled day-ahead prices to a record high of $133.85/mn Btu on 26 January at Transco zone 5, a bellwether market for demand between the Georgia-South Carolina and Virginia-Maryland borders. Trading firms imported LNG to Georgia's 4mn t/yr Elba Island and Maryland's 5.75mn t/yr Cove Point terminals for the first time in more than five years, with BP shipping two cargoes to Cove Point and Shell sending one to Elba Island, data from trade analytics firm Kpler show.
Last month's events may have exposed the limits of a market that has seen its flexibility eroded over the past decade, as the US' rapid rise to the rank of top global LNG exporter has not been matched by comparable investment in storage.
Underground storage capacity has remained flat over the past decade, during which time the US has transformed from a net gas importer into the world's largest LNG producer. That process has left the US with little slack in its gas system, particularly on the Gulf coast during periods of weather-related supply disruptions. Aggregate US storage capacity stood at 4.67 trillion ft³ in November, the most recent data made available by the EIA show. This compares with 4.66 trillion ft³ a decade earlier, when the country was on the cusp of shipping its first domestically produced LNG cargo from the lower 48 states.
Storage capacity available at present likely equates to approximately 14pc of the overall size of the US market, compared with 17pc a decade earlier. The imbalance is even more striking in the key exporting states of Texas and Louisiana, where total designed storage capacity has remained flat at 988bn ft³ over the past 10 years, while feedgas to Gulf coast LNG facilities has risen to 16.5bn ft³/d at the end of 2025 from virtually zero a decade earlier, before the Sabine Pass facility had been commissioned.
Up to speed
Differences across storage withdrawal ratescan also add to price volatility. The south-central region has the highest technical withdrawal capacity of about 51.8bn ft³/d, in part because almost a third of its storage sites consist of salt caverns, according to the EIA. Salt caverns can send out gas much faster than storage at depleted reservoirs and aquifers, which make up the majority of capacity in other regions and have withdrawal speedsof around 4.3bn-28.2bn ft³/d.
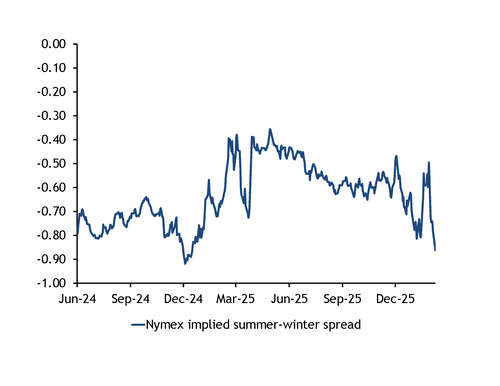
Narrow seasonal spreads in US gas prices have caused investments in storage capacity to dry up since the beginning of the last decade. Nymex futures contracts for delivery at the Henry Hub this summer currently hold a 86¢/mn Btudiscount to corresponding contracts for delivery in winter months, having slightly expanded from last year's average of 55¢/mn Btu. Tighter spreads reduce the intrinsic value of storage capacity — or the ability for capacity holders to lock in margins months or years in advance because of the seasonal spread in gas prices. But the volatility caused by growing LNG production is increasing the extrinsic value of storage — the ability to benefit from short-term price volatilitybecause of the additional optionality gas stocks provide — resulting in renewed interest in investing in such capacity.
Extreme weather will continue to threaten price volatility until more underground gas storage is built. Projects comprising 262bn ft³ of capacity have been proposed in the US in recent years. If all are built, the country's capacity would increase by nearly 6pc, after holding flat at around 4.7 trillion ft³ since 2015. Even so, liquefaction capacity is expected to grow at an even faster pace, following a banner year for investments in US LNG in 2025. US liquefaction capacity is predicted to increase by 80pc over 2026-30, reaching nearly 225mn t/yr, or 28bn ft³/d, by the end of the decade.