Combined gas demand across the Finnish and Baltic region fell by 4pc on the year in April despite gas-fired power generation rising by nearly 50pc.
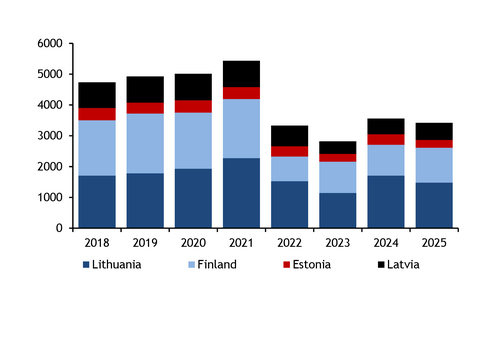
Aggregate consumption in Finland, Estonia, Latvia and Lithuania in April fell to 3.42TWh, down from 3.56TWh the previous year and the three-year average of 5.12TWh in 2019-21. That said, it was still higher than in both 2022 and 2023 (see consumption graph).
Lithuania remained the region's largest consumer, as it has been for every month since June, again driven by an increase in gas-fired power generation. Average gas-fired output soared by nearly 400pc on the year in April to 254MW according to data from Fraunhofer ISE, more than making up for a 43pc drop in Finnish production (see power table). Following the de-synchronisation of the Baltic states from the post-Soviet Brell system, gas-fired power plants have become particularly important in the region, not just for producing electricity but also for providing ancillary services such as frequency reserves. Lithuania has the largest gas-fired fleet in the region, and its output jumped despite domestic power consumption falling by more than 5pc on the year and renewable output increasing, which allowed the country to cut its power imports last month to 104MW, from 546MW in the previous year.
With power sector gas demand increasing in April but overall gas consumption in the region dropping, demand from households and industries must have been lower on the year. Weather patterns were split across the region, with lower average minimum temperatures than the previous year in Vilnius and Riga, but higher in Tallinn and Helsinki. That said, overnight lows in all four capitals were still above the 2015-24 average last month, limiting strong heating demand in the shoulder month (see temperature table).
Traded volumes on the region's gas exchange GET Baltic rose to 1.1TWh last month, an "unusually high result for this time of year" according to the exchange's senior account manager Karolis Bagdonas. Of the overall volume, 56pc traded in Lithuania, 28pc in the joint Estonia-Latvia market area, and the remaining 16pc in Finland. The average price on GET Baltic was €39.40/MWh last month, down by around 8pc from March. GET Baltic announced in April that its full integration into the European Energy Exchange (EEX) had been delayed again until 9 September, having previously been planned for 27 May.
Across all of January-April FinBalt consumption totalled 18.43TWh, down from 20.04TWh in the same period of 2024.
Stocks at the region's only storage facility in Latvia ended the storage year on 1 May at 8.4TWh, below 11.3TWh on the same day last year and 9TWh in 2023, but still above all other years since 2018 (see data and download). The entire 100pc of capacity, amounting to just over 23TWh, had been booked for the 2024-25 storage year, but for the new 2025-26 cycle a lower 17TWh has been allocated, representing around 68pc of the cycle's total technical capacity of 24.9TWh. Consistently positive summer-winter spreads over the winter period, which gave no financial incentive to book storage, may have driven lower interest in 2025-26 capacity, although they had normalised by April. Lower overall booked volumes is despite operator Conexus managing to sell all 9TWh of the new five-year capacity product it offered in February and March.
Slow start to injection season
Injections into Incukalns have been weak so far this year, with not a single day of net injections until 24 April.
In the previous year, there had been some brief net injections on 1-4 April at an average of 54 GWh/d, and across all of April they averaged just over 7 GWh/d. In contrast, this year's April averaged net withdrawals of 32 GWh/d across the month, with injections only on 24-30 April. This slow stockbuild has continued in the first week of May, with 35GWh of net injections on 1 May but then a flip back to very minor net withdrawals of 0.2 GWh/d on every day of 2-6 May, the latest data from GIE show. Last year, there were average net injections of 47 GWh/d on 1-6 May, and 39 GWh/d in 2021-23.
Despite weak injections, overall LNG sendout across the region's three terminals of Klaipeda, Inkoo and Hamina has increased significantly from April, nearly doubling to 150 GWh/d on 1-7 May from 80 GWh/d in April. Sendout from these terminals averaged 84 GWh/d on 1-7 May last year.
Rather than injecting all of the regasified LNG, some of it is being sent southward to Poland at Santaka, with exit flows at the point averaging 22 GWh/d on 1-7 May, switched from net inflows of 2 GWh/d in April. This is likely to be linked to Polish incumbent Orlen's deals to supply LNG to Ukraine's Naftogaz, of which one of the contracts specified that it would be delivered to Klaipeda and transited to the Ukrainian border.
| FinBalt gas-fired power production | MW | ||
| Apr-25 | Apr-24 | year-on-year % change | |
| Finland | 118 | 206 | -43 |
| Estonia | 6 | 5 | 20 |
| Latvia | 85 | 53 | 60 |
| Lithuania | 254 | 52 | 388 |
| Total | 463 | 316 | 47 |
| — Fraunhofer ISE | |||
| FinBalt average minimum temps | °C | ||
| Apr-25 | Apr-24 | 2015-24 avg | |
| Helsinki | 0.7 | 0.1 | 0.1 |
| Talinn | 2.2 | 2.0 | 1.0 |
| Riga | 4.8 | 5.0 | 4.0 |
| Vilnius | 3.8 | 5.2 | 2.8 |
| — Speedwell | |||